Saturday, April 6, 2024

ECG Blog #424 — Proportionality and the "Cut Off"


The ECG in Figure-1 was obtained from a middle-aged woman — who presented with low back pain, shortness of breath and marked hypertension — but no CP (Chest Pain).


QUESTIONS:
  • In view of this history — How would YOU interpret this ECG?
  • Are the large, peaked T waves (especially in lead V2) — likely to indicate hyperacute deWinter T waves?
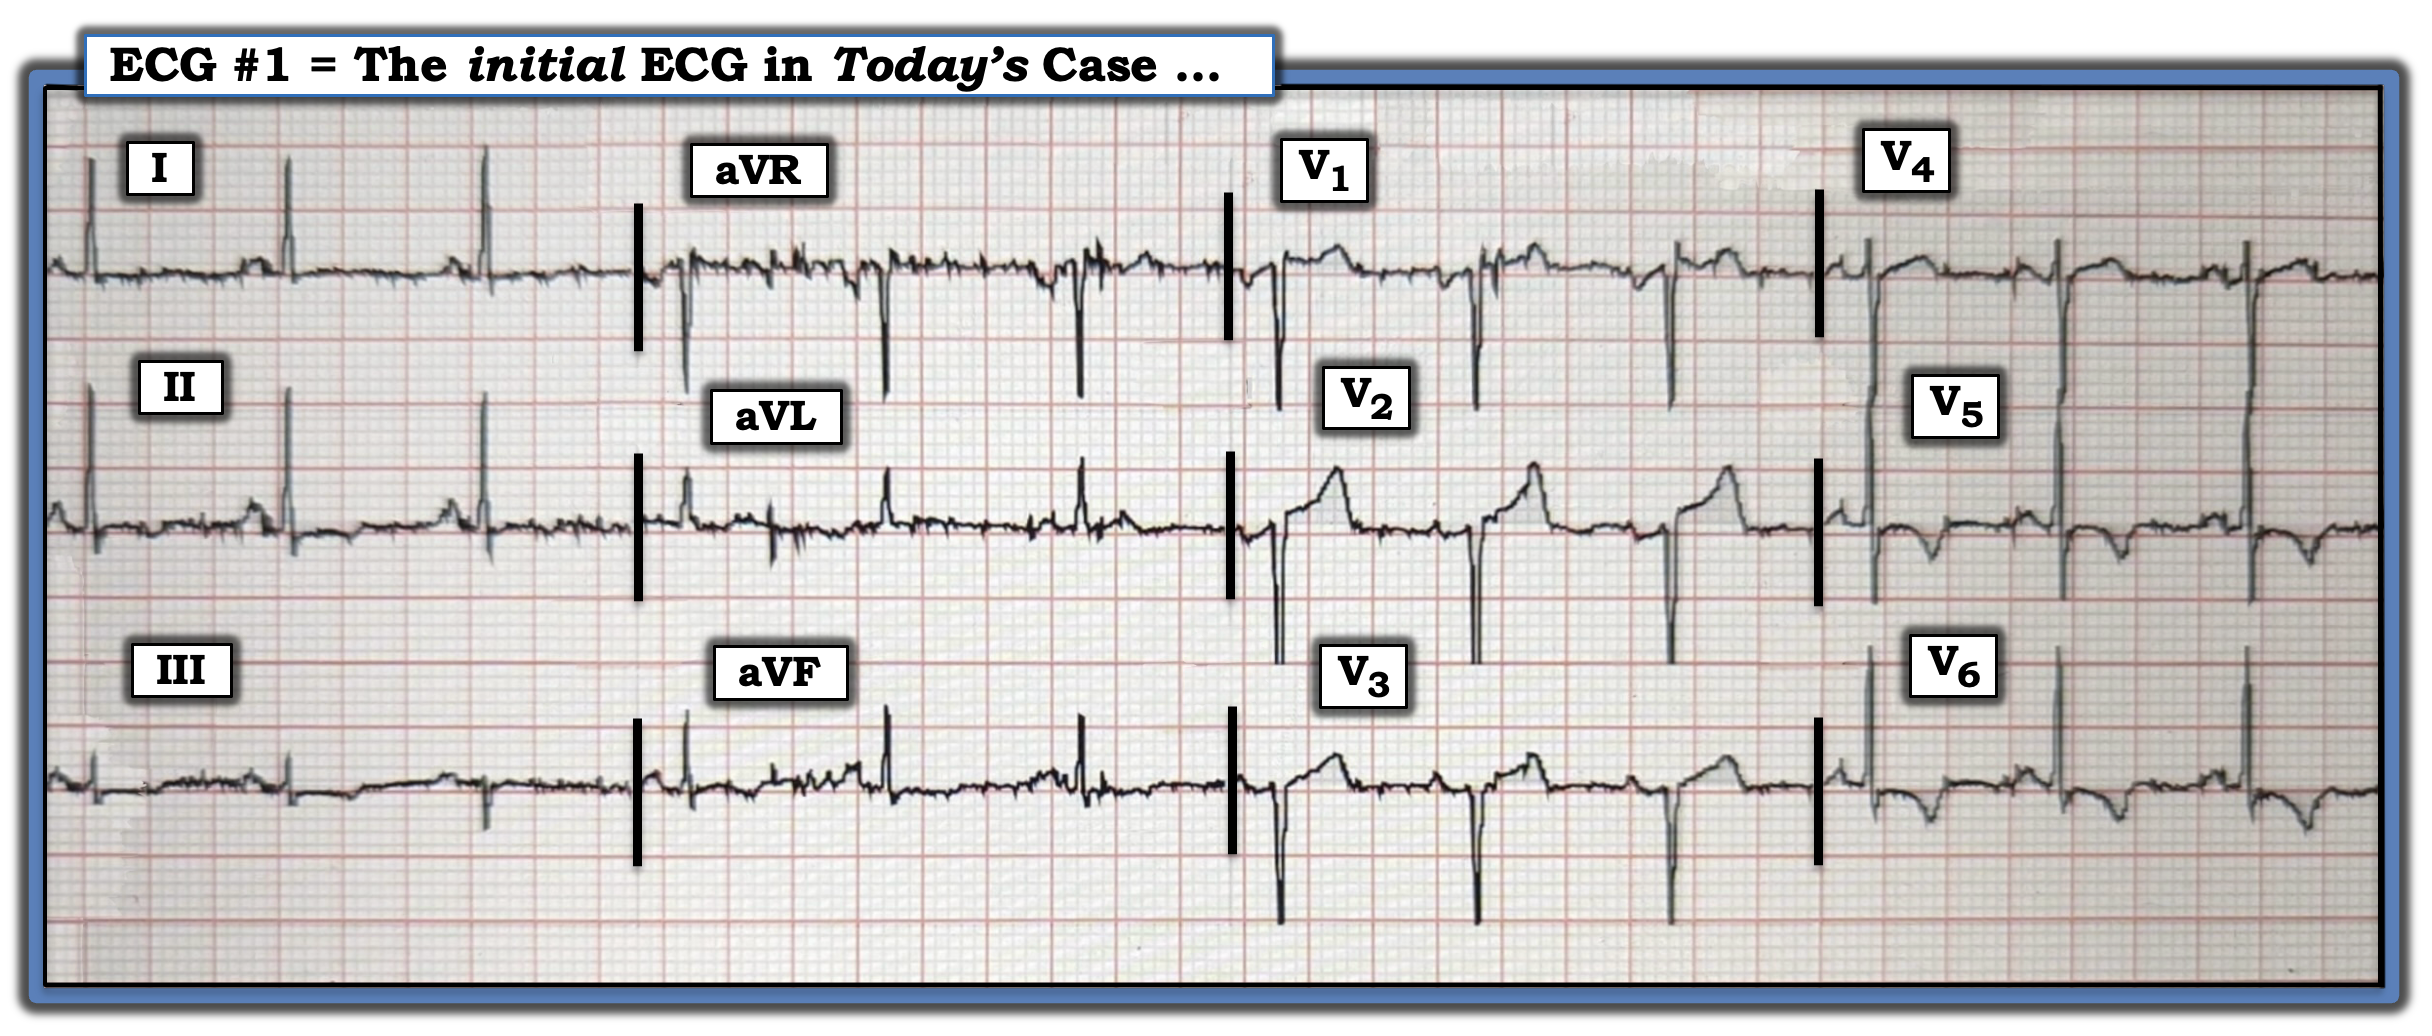
Figure-1: The initial ECG in today's case.


PEARL #1: Did YOU notice that S wave amplitude is cut off in leads V2 and V3? (and possibly also in lead V1). 
  • As a result — We have no idea how deep the S wave really is in these leads! This is especially true in lead V2, given slight-but-real separation between descending and ascending limbs of the S wave in this lead (See dotted RED lines highlighting abrupt S wave "cut-off" in Figure-2).

  • It is extremely likely that voltage criteria for LVH (as listed in the ADDENDUM below in Figure-3) would have been easily satisfied IF this ECG had been recorded at half-standardization, so as to enable us to capture full dimensions of the QRS complex in the anterior leads. Given the age of today's patient — and her markedly elevated BP on exam, the finding of LVH is not at all unexpected.
  • KEY Point: In the United States, there is a limit to the amount of voltage that prehospital ECGs in most EMS (Emergency Medical) Systems are able to display. As a result — QRS amplitudes are automatically truncated once they exceed that limit (which typically is 10 mm for the deepest S wave and tallest R wave).
  • Once aware of this automatic truncation of ECG amplitudes that is used in most EMS systems in the United States — it becomes EASY to spot (as shown below in Figure-2).

Figure-2: I've labeled with dotted RED lines the S wave "cut-off" in leads V2,V3. I've also added the mirror-image view of leads V2,V3 (within the RED inserts) — showing how likely it is that today's patient has LVH (See text). 


More Technical Misadventures in Today's CASE:
In addition to automatic truncation of anterior S waves — 2 additional "technical misadventures" are seen in today's tracing:
  • There is significant baseline artifact. Although worse in leads aVR,aVL,aVF — fine undulations alter the baseline in virtually all leads in Figure-2. While we are still able to interpret ST-T wave morphology — this baseline artifact clearly renders our assessment less clear. 
  • The lead V1 ectrode is most probably placed too high on the chest because: i) There is an rSr' complex in lead V1; ii) QRS morphology in lead V1 looks very similar to QRS morphology in lead aVR; and, iii) There is a significant negative component to the P wave in lead V1 (See ECG Blog #274 — for review on how to quickly recognize too-high electrode lead placement of leads V1,V2). Since the focus of our attention in today's case is on the anterior leads — alteration of ST-T wave appearance in lead V1 because of erroneous placement of the lead V1 electrode clearly affects our interpretaton.


PEARL #2: Sometimes with LVH — instead of seeing tall R waves with LV "Strain" in the lateral chest leads — we see the "mirror-image" opposite picture in right-sided leads V1,V2 (ie, LVH may be manifested by deep anterior S waves — with ST elevation in leads V1,V2 and/or V3). This is precisely what we see in today's case!
  • LOOK at the RED inserts in Figure-2 — that show the mirror-image of leads V2 and V3. The dotted RED line highlights that the R wave of this inverted complex would almost certainly be a good bit taller — IF there wasn't "automatic truncation" of the S waves in leads V2,V3 on this EMS ECG.

  • DON'T the ST-T waves in these inverted RED inserts look identical to the ST-T wave appearance of LV "strain"? (ie, Panel C in Figure-4 below in today's ADDENDUM).

  • KEY Point: The concept of "proportionality" is essential to recognize! Today's patient with marked hypertension has LVH that is manifest on ECG by deep anterior S waves (in leads V1,V2,V3) — except that these S waves are "cut off" because of the automatic truncation inherent in this EMS ECG. As a result, the ST elevation (with especially tall, peaked T wave in lead V2) — is not indication of acute ischemia. Instead, it is the manifestation of LV "strain" that is best seen in this anterior lead. IF anterior S wave depth would not have been cut off — then the tall, peaked T wave in lead V2 of Figure-2 would probably be proportional to the deep S wave in this lead.

  • A picture is worth 1,000 words. For additional examples of this phenomenon whereby automatic truncation of an EMS ECG may mistakenly result in LVH serving to mimic ischemia — Check out My Comment at the bottom of the page of the following posts in Dr. Smith's ECG Blog — the November 29, 2023 post — June 20, 2020 — March 31, 2019 — March 29, 2019 — and the December 27, 2018 post.


PEARL #3: Another reason why some clinicians may have been concerned about anterior (or anteroseptal) infarction from today's initial ECG — is the Poor R Wave Progression (ie, There is virtually no r wave in Figure-2 until lead V4!).
  • While it may not be possible on this single ECG to absolutely rule out anterior (anteroseptal) infarction at some point in time — it's important to remember that marked LVH that is primarily manifest by deep anterior S waves (rather than by tall lateral R waves) — produces a vector in which the hypertrophied, posterior-lying left ventricle opposes normal anterior forces. Thus, it is at least in part because of the deep anterior S waves from LVH that R wave progression in Figure-2 is much less than expected.


PEARL #4: The remaining finding of note on today's ECG — relates to the ST segment coving with symmetric T wave inversion in leads V5,V6 of Figure-2.
  • The KEY lies in the history. Today's patient is a middle-aged woman who presented with low back pain, shortness of breath and marked hypertension — but no chest pain.
  • As suggested by Figure-4 below in the ADDENDUM — assessment of the ST-T waves in leads V2,V3 and V5,V6 — is consistent with ischemia and/or LV "strain". While perfectly appropriate to obtain serial ECGs and troponin values in this acutely ill patient — I suspect troponins will be negative, and serial ECGs will confirm that there is no acute OMI. 
  • The PEARL is that LVH with "strain" may mimic ischemia — and this ECG finding of lateral lead ST coving with symmetric T wave inversion is often seen in patients who present with marked hypertension, especially in the absence of new chest pain as a presenting complaint.


FINAL Thoughts:
I unfortunately do not have clinical follow-up on today's case. That said — My final thoughts on the case include:
  • The need to find out WHY this patient is short of breath.
  • Wanting to see the initial hospital ECG — in which there should be no limitation of voltage on the ECG recording. I would expect this hospital ECG to show very deep anterior S waves, consistent with LVH.
  • Ruling out an acute event (As noted above — I would expect serial ECGs and troponins to be negative for acute OMI).


==================================
Acknowledgment: My appreciation for anonymous donation of today's case.
==================================


Related ECG Blog Posts to Today’s Case:
  • ECG Blog #205 — Reviews my Systematic Approach to 12-lead ECG Interpretation. 

  • ECG Blog #73 — Reviews "My Take" on the ECG Diagnosis of LVH. 
  • ECG Blog #92 — Presents another perspective for ECG Diagnosis of LVH.
  •  
  • The November 4, 2018 post in Dr. Smith's ECG Blog — My Comment (at the bottom of the page) reviews 3 ECG Clues for rapid recognition of erroneous lead V1,V2 placement. 
  • For cases similar to today, in which LVH may mimic ischemia — Check out My Comment at the bottom of the page of the following posts in Dr. Smith's ECG Blog — the November 29, 2023 post — June 20, 2020 — March 31, 2019 — March 29, 2019 — and the December 27, 2018 post.

  • ECG Blog #266 — Reviews some considerations when distinguishing between deWinter T Waves vs Posterior MI.
  • ECG Blog #183 — Reviews a case of deWinter T Waves (with the Audio Pearl in this post discussing some variants of the deWinter T wave pattern). 
  • ECG Blog #53 — and ECG Blog #340 — Review more cases of deWinter T Waves.

  • ECG Blog #218 — Reviews HOW to define a T wave as being Hyperacute? 
  • ECG Blog #230 — Reviews HOW to compare Serial ECGs (ie, "Are you comparing Apples with Apples or Oranges?"). 


================================== 

ADDENDUM (4/6/2024): I've added below in Figure-3 and Figure-4 additional material to facilitate ECG diagnosis of LVH and LV "strain".


Figure-3: The voltage and other criteria I favor for ECG diagnosis of LVH (Please see ECG Blog #73 for additional details).


Figure-4: Illustration and description of LV “strain” and a “strain equivalent” pattern (See text).


Sunday, March 31, 2024

ECG Blog #423 — Flank Pain, Heartburn & an ECG


I was sent the ECG in Figure-1 with the information that this man in his 60s presented to the ED (Emergency Department) — for flank pain of several days duration (that he thought was from a kidney stone) and an intermittent "heartburn" sensation over the past few weeks.


QUESTIONS:
  • Given the above history — How would YOU interpret this patient's initial ECG, that was obtained on arrival in the ED?

  • Should you activate the cath lab? 

Figure-1: The initial ECG in today's case. (To improve visualization — I've digitized the original ECG using PMcardio). 


Would YOU Activate the Cath Lab?
Many providers would look at the initial ECG shown in Figure-1 — and say, "This is not a STEMI — therefore there is no need to activate the cath lab at this time". 
  • STEMI Criteria are not satisfied in ECG #1 — because in this man ≥40 years old, ≥2 mm of ST elevation is not attained in consecutive anterior leads V2 and V3.
  • Unfortunately, following the outdated, millimeter-based STEMI Paradigm in today's case — would result in needless delay in reperfusion of acute coronary Occlusion, with potential loss of a significant amount of salvageable myocardium.

  • KEY Point: To interpret ECG #1 in the absence of awareness of the newer, superior OMI Paradigm is to risk missing at least 30% of all acute OMIs (acute MIs resulting from acute coronary Occlusion) — as discussed in detail in our ECG Video Blog series in Blog #406 — Blog #407 — and Blog #408.


MY Thoughts on Today's Initial ECG:
The initial ECG in today's case (as shown in Figure-1) — is not "normal".
  • The rhythm is sinus at ~75/minute (with upright P waves and a constant PR interval in lead II). All intervals (PR, QRS, QTc) and the frontal plane axis are normal (ie, The isoelectric QRS complex in lead aVF, with maximal net R wave amplitude in lead I — suggests a frontal plane axis near 0 degrees). There is no chamber enlargement.
Regarding Q-R-S-T Wave Changes:
  • Q waves: Tiny (normal) septal q waves are seen in lateral leads I, aVL and V6. It is hard to determine if a tiny initial positive deflection (r wave) is or is not seen in lead III — but neither of the other 2 inferior leads ( = leads II,aVF) manifest a Q wave.
  • R wave progression: Normal-sized R waves are seen in anterior leads V1,V2 — with normal transition (Height of the R wave becomes greater than depth of the S wave between leads V2-to-V3, which is normal).

The ECG findings of potential concern relate to the ST-T Wave Changes — that I highlight in Figure-2.
  • Did YOU See these areas that raised my concern?

Figure-2: I've labeled the initial ECG in today's case.


=============================
To Emphasize: The History in today's case is not typical for acute MI, in that this patient did not present with CP (Chest Pain). Instead — today's patient presented with a potential "CP-equivalent" symptom (ie, a "heartburn" sensation), albeit this sensation of "heartburn" was of uncertain duration.
  • PEARL #1: As emphasized in ECG Blog #228 — Not all patients with acute MI have chest pain. Instead, the estimated incidence of "Silent" MI may be as high as between 20-40% of all MIs (depending on the definition used). As a result — lack of chest pain in today's case does not rule out the possibility of acute MI given the patient's age (in his 60s) — and given the description of "a heartburn sensation", as this symptom is commonly confused with cardiac CP.

  • PEARL #2: One of my favorite history questions to ask is, "What happened today (instead of yesterday, or the day before) — that led you to come to the ED?" To emphasize that we do not know the answer to this question from the brief history provided above at the beginning of this case.
  • IF the reason this patient presented to the ED today is that his "heartburn" got significantly worse — this would be important imformation that would greatly increase the likelihood that even subtle ECG changes may be an important clue to an ongoing acute cardiac event.

=============================

The ECG Changes of Concern in Today's Case:
I was concerned by the appearance of 6/12 leads in Figure-2:
  • For me in Figure-2 — the most "eye-catching" ST-T wave abnormality is in lead V2 (within the RED rectangle).

  • PEARL #3: Normally, there should be a small amount of gradually-upsloping ST elevation in anterior leads V2,V3. Instead — the amount of J-point ST elevation in lead V2 is excessive (ie, as per the PURPLE arrow in this lead). In addition — the gently upsloping shape of the ST segment in lead V2 has been replaced by the abnormally straightened ST segment "takeoff" (straightening of the RED line in this lead).

  • PEARL #4: I favor looking for 1 or more leads that I know are abnormal. Once found — then more subtle findings in neighboring leads become much more likely to be supportive of an acutely evolving cardiac event. For example, in Figure-2 — the amount of J-point ST elevation in lead V3 is not excessive — but in the context of the definitely abnormal amount and shape of the elevated ST segment in lead V2 — the ST segment straightening that we also see in lead V3 is also abnormal!

PEARL #5:
 The more leads in a given tracing with abnormal ST-T wave changes — the greater the likelihood that an acute evolving cardiac event is ongoing. So while important to appreciate that not all anterior OMIs manifest reciprocal ST depression in the inferior leads — IF you do see inferior lead ST depression, this provides additional support that even subtle ST elevation in the anterior leads is likely to be acute.
  • Each of the 3 inferior leads in Figure-2 manifest reciprocal ST segment depression (within the BLUE rectangles in leads II,III,aVF).
  • By far — lead aVF manifests the most abnormal ST depression, given how small amplitude of the QRS complex is in this lead. There is therefore no doubt that the scooped, downsloping ST segment with terminal T wave positivity in lead aVF has to be assumed acute until proven otherwise!
  • In the context of knowing that the ST-T wave in lead aVF is abnormal — the more subtle-but-real ST segment straightening with slight depression in leads II and III adds further support to our impression that there is reciprocal inferior lead ST depression.
  • KEY Point: Any doubt that I may have had about whether ST-T waves in anterior leads V2 and V3 were truly abnormal — was eliminated the moment I saw the definitely abnormal ST-T wave in lead aVF!

  • PEARL #6: The isolated finding of T wave inversion in either lead III and/or lead aVF in association with a predominantly (or entirely) negative QRS — is not necessarily abnormal. BUT — the finding of ST segment straightening with some amount of ST depression in lead III, instead of just T wave inversion (as highlighted by the BLUE arrow in Figure-2) — is clearly not normal. And, ST flattening with some ST depression in lead III is even more definitely abnormal when it occurs in association with ST-T wave depression in the other 2 inferior leads! (as it does in today's case).

  • PEARL #7: My "Go-To" Lead when I find myself contemplating the possibility of an acute anterior OMI — is lead aVL. The presence of even subtle ST elevation (as highlighted by the BLUE arrow in Figure-2) solidifies our suspicion of an acute cardiac event in today's case.
  • Note that there is fulfillment of the "magical" reciprocal (ie, mirror-image opposite) shape of the ST-T wave for the subtle ST depression in lead III — and the equally subtle ST elevation in lead aVL. This provides yet one more indication that despite the lack of new CP in today's case — the collective abnormal ST-T wave findings in the 6 leads highlighted in Figure-2 strongly suggest an acute evolving cardiac event!

  • PEARL #8: The distribution of ST-T wave changes in today's case suggests the ECG pattern known as Precordial Swirl — in that there is ST segment straightening and elevation in leads V1,V2 with some coved ST depression in lead V6. The clinical significance of recognizing the pattern is that it suggests a very proximal occlusion of the LAD involving the interventricular septum (See ECG Blog #380).

  • PEARL #9: Among the actions to undertake at this point in today's case are the following: i) Go back and carefully question the patient — trying to get a better "feel" for the likelihood that his "sensation of heartburn" may or may not represent a "CP equivalent" symptom — with focus on how much this sensation increased today, and how severe it was at the time the initial ECG was done; and, ii) Assuming at least 10 minutes have passed since ECG #1 was recorded — Repeat the ECG.

  • To Emphasize — In the absence of acute symptoms, immediate activation of the cath lab may not yet be indicated on the sole basis of ECG #1. That said — IF an acute cardiac event is indeed ongoing — then serial ECGs (repeated as soon as between 10-30 minutes after the initial ECG) — in conjunction with clinical information (ie, initial troponin values, correlation with the presence and ongoing severity of symptoms with each serial ECG that is done) — are actions likely to quickly confirm the need for prompt cardiac catheterization.

=============================

Today's CASE Continues:
A prior ECG on today's patient was found. For clarity in Figure-3 — I have put this previous ECG together with today's initial tracing:


QUESTION:
  • What do we learn from this prior tracing?

Figure-3: Comparison between the 2 ECGs in today's case. (To improve visualization — I've digitized the original ECG using PMcardio). 


What We Learn from the Prior ECG:
While the ST-T wave changes in today's initial ECG are subtle and do not satisfy millimeter-based STEMI criteria — there can be no doubt from comparison with the prior tracing shown in Figure-3 — that ST-T wave findings highlighted in the initial ECG are new!
  • Despite no significant change in chest lead QRS morphology — the ST segment straightening in leads V2 and V3 was not previously present! In addition — there previously was no ST elevation in lead V2 — and there was even a hint of ST depression in lead V3.
  • In the limb leads — inferior lead ST depression was far less than in today's initial ECG — and there previously was no ST elevation in lead aVL.

  • BOTTOM Line: While questions remain from brevity of the history as to when the ECG findings noted in ECG #1 may have developed — there is no doubt that the above-noted ST-T wave findings in today's initial ECG are new since the prior tracing from ~1 year ago was done. As a result — an acute and/or recent LAD (Left Anterior Descending) OMI must be assumed until proven otherwise.

  • Cardiac Cath was ultimately performed in today's case — almost 7 hours after arrival in the ED. It revealed multi-vessel disease, with "culprit" lesions in both the proximal LAD, as well as in the 1st Diagonal Branch of the LAD. Reperfusion with PCI was successful.
  • Among the actions undertaken during the hours until cardiac cath was performed, were: i) Return of 3 abnormal troponin assays, with progressively increasing values; ii) Several repeat ECGs, including one in which the acute ECG findings highlighted in Figure-2 had greatly improved (albeit no notation was made regarding the presence and/or relative severity of the patient's symptoms at this time); and, iii) Coronary CT scan — showing subtotal occlusion of the proximal LAD.

Final COMMENT: Cardiac catheterization in today's case should not have been delayed for nearly 7 hours.
  • Although assessment of today's case was understandably made more difficult by the lack of chest pain — the possibility that the patient's "heartburn" might be an acute "CP equivalent" was apparently not explored.
  • Even without a history of "new CP-equivalent symptoms" — the abnormal findings in the initial ECG (as detailed in discussion of Figure-2) — place the onus on medical providers to assume acute OMI until proven otherwise. 

  • As soon as the prior ECG was found — it should have been obvious that the ST-T wave changes in the initial ECG were definitely acute. In this context — any troponin elevation is a mandate for prompt cath.

  • "Dynamic" ST-T wave changes (ie, the improvement of ECG findings on a serial tracing) — should have served as additional indication for prompt cath.

  • In the context of the above events — further delay to perform coronary CT scan serves no useful purpose. The above described ECG findings (especially in association with any even minimally elevated troponin value) — defines today's case as an acute OMI in need of prompt cath. This need for prompt cath would not be changed regardless of coronary CT scan results (ie, Spontaneous reperfusion is suggested in today's case by the "improvement" in abnormal ECG findings — which could have shown up as a "non-critical stenosis" = "negative" result on coronary CT scan). 
  • As emphasized often in this ECG Blog — prompt cath with PCI is still indicated after spontaneous reperfusion because of the high risk in ensuing hours of spontaneous reocclusion (See ECG Blog #326 — Blog #337 — and Blog #320, among many others).


==================================
Acknowledgment: My appreciation to Hans Helseth (from Minneapolis, Minnesota, USA) for the case and this tracing.
==================================


Related ECG Blog Posts to Today’s Case:

  • ECG Blog #205 — Reviews my Systematic Approach to 12-lead ECG Interpretation.

  • ECG Blog #193 — Reviews the basics for predicting the "culprit" artery (and review of why the term "STEMI" — should be replaced by "OMI" = Occlusion-based MI).
=================================
  • CLICK HERE — for my 6 new ECG Videos (on Rhythm interpretation — 12-lead interpretation with Case Studies for ECG diagnosis of acute OMI).
  • CLICK HERE — for my 2 new ECG Podcasts (on ECG & Rhythm interpretation Errors — and — Errors in assessing for acute OMI).
=================================
    • Recognizing hyperacute T waves — patterns of leads — an OMI (though not a STEMI) — See My Comment at the bottom of the page in the November 8, 2020 post on Dr. Smith's ECG Blog.
    • Recognizing ECG signs of Precordial Swirl (from acute OMI of LAD Septal Perforators) — See My Comment at the bottom of the page in the March 22, 2024 post on Dr. Smith's ECG Blog — as well as ECG Blog #380.

    • ECG Blog #294 — Reviews how to tell IF the "culprit" artery has reperfused.
    • ECG Blog #230 — Reviews how to compare serial ECGs.

    • ECG Blog #115 — Shows how dramatic ST-T changes can occur in as short as an 8-minute period.
    • ECG Blog #268 — Shows an example of reperfusion T waves.
    • ECG Blog #400 — Reviews the concept of "dynamic" ST-T wave changes.
    • ECG Blog #387 — Dynamic change in 2 minutes.

    • ECG Blog #337 — A "NSTEMI" that was really an ongoing OMI of uncertain duration (presenting with inferior lead reperfusion T waves).
    • ECG Blog #258 — How to "Date" an Infarction based on the initial ECG.

    • ECG Blog #184 — illustrates the "magical" mirror-image opposite relationship with acute ischemia between lead III and lead aVL (featured in Audio Pearl #2 in this blog post). 

    • The importance of the new OMI (vs the old STEMI) Paradigm — See My Comment in the July 31, 2020 post in Dr. Smith's ECG Blog.
    • For review on when despite acute OMI — the initial hs-troponin may come back normal — See the March 24, 2023 post in Dr. Smith’s ECG Blog.


    ==================================

    ADDENDUM (3/31/2024): 
    • I've added a series of Audio Pearls relevant to today's case. 

    ECG Media PEARL #1 (3:00 minutes Audio) — Reviews the concept of deWinter T waves (and the many variations on this "theme" ).


    ECG Media PEARL #35a (4:50 minutes Audio) — WHEN is a T Wave Hyperacute vs a Repolarization variant?


    ECG Media PEARL #39a (4:50 minutes Audio) — Reviews the concept of dynamic ST-T Wave Changes (and how this ECG finding can assist in determining if acute cardiac cath is indicated).


    ECG Media PEARL #46a (6:35 minutes Audio) — How to compare serial ECGs (ie, Are you comparing "Apples with Apples" — or — with Oranges?).


    ECG Media PEARL #10 (10 minutes Audio) — reviews the concept of why the term “OMI” ( = Occlusion-based MI) should replace the more familiar term STEMI — and — reviews the basics on how to predict the "culprit" artery.


    ECG Media PEARL #11 (6 minutes Audio) — Reviews how to tell IF the “culprit” (ie, acutely occluded) artery has reperfused, using clinical and ECG criteria. 


    Wednesday, March 27, 2024

    ECG Blog #422 — Was Clubbing an ECG Hint?


    I was sent the ECG in Figure-1 — with the following history:
    • The patient is a young man in his early 20s — who presents to the ED (Emergency Department) because of SOB (Shortness Of Breath) that had been ongoing for several hours. No chest pain.
    • He reports a number of similar previous episodes over the past few years (although apparently has not been formerly evaluated for this).
    • Physical exam remarkable for tachypnea (respiratory rate ~30/minute) and cyanosis, with clubbing of extremities.

    QUESTIONS:
    • In view of the above history — How would YOU interpret the ECG in Figure-1?
    • Is the rhythm likely to be VT (Ventricular Tachycardia)?

    Figure-1: The initial ECG in today’s case.


    MY Initial Thoughts on Figure-1:
    Although technically there is some folding and distortion of this 12-lead tracing — the recording speed is the standard 25 mm/second — and quality of the tracing clearly is sufficient for evaluation.
    • There is a regular WCT (Wide-Complex Tachycardia) in Figure-1 — at a rate of ~190/minute, but without clear sign of sinus P waves.
    • I thought that some kind of atrial activity might be present — but I was not certain of this. Despite the presence of a slender upright deflection before each P wave in lead I — there was no such upright deflection in lead II (as is needed for the rhythm to be sinus).
    • I considered the possibility of 1:1 retrograde P waves (VA conduction) — but I did not know if the slender negative “dip” in the middle of the inferior lead ST-T waves represented a retrograde P wave vs simply being the ST segment alone.

    • PEARL #1: Even if this negative “dip” in the inferior lead ST segments did represent retrograde P waves — this would not be of any assistance for distinguishing between some form of  SVT (SupraVentricular Tachycardia) vs VT — because reentry SVT rhythms and VT may both manifest 1:1 VA retrograde conduction.

    • MY Conclusion Thus Far: The rhythm in Figure-1 represents a regular WCT rhythm at ~190/minute, without clear sign of sinus P waves. This leaves us with the usual differential diagnosis for this rhythm presentation (as per ECG Blog #361) ==> We need to consider i) VT until proven otherwise: ii) SVT with either preexisting BBB or aberrant conduction; — or, iii) Something else (ie, WPW, hyperkalemia, some other toxicity, etc.).


    PEARL #2: How Might the History Help?
    Statistically — When an older adult with known underlying heart disease presents to the ED in a regular WCT rhythm, but without clear sign of sinus P waves — the odds that the rhythm will turn out to be VT are ~90% even before you look at the ECG. But this is not the situation in today's case — since today's patient is a man in his early 20s.
    • Although this young adult age range places today's patient in the group most susceptible to some form of idiopathic VT (See ECG Blog 197) — Strongly against a diagnosis of idiopathic VT are the physical findings of cyanosis and clubbing of the extremities, since these findings strongly suggest some form of underlying cardiopulmonary disease.


    PEARL #3: What about QRS Morphology?
    As discussed in detail in many of my blog posts that break down the assessment of regular WCT rhythms — QRS morphology may provide invaluable assistance for working through the differential diagnosis (See ECG Blog #42, among many others).
    • Although no morphologic criterion is perfect for distinguishing between supraventricular conduction vs VT — the more QRS morphology of a regular WCT rhythm resembles some known form of conduction defect, the greater the chance that the rhythm is of supraventricular etiology. 
    • Conversely — the more abnormal-looking QRS morphology during a regular WCT rhythm is (ie, the less it resembles some known form of conduction block) — the greater the chance that the rhythm represents an ischemic form of VT.

    Today's case therefore presents the paradox that despite this patient's young age — QRS morphology of his ECG manifests many atypical features. These include: i) Significant fragmentation (ie, multiple leads in Figure-1 showing multiple "extra notching" of the QRS complex); and, ii) Bizarre shape of the QRS complex in lead V1, with a rounded R' deflection instead of a more defined triphasic rsR' configuration (as is most often seen with RBBB-conduction in a younger adult).
    • PEARL #4: The combination of longstanding dyspnea episodes in this young adult with cyanosis and extremity clubbing + the above described atypical QRS morphology during his WCT — should suggest some form of significant underlying cardiopulmonary disease. High on my list of possibilities was an expression of CHD (Congenital Heart Disease) in an adult.

    • This still leaves us with the differential diagnosis for the regular WCT rhythm in today’s case between a fascicular VT (given some resemblance to rbbb conduction in the chest leads — with marked right axis deviation in the limb leads) — vs some form of an SVT rhythm, in which the patient’s baseline tracing was rendered markedly abnormal from longstanding CHD.
    • MY Hunch: Awareness of the longstanding nature of today’s patient’s symptoms from some presumed form of established CHD — made me suspect that a supraventricular etiology would be more likely, rather than sudden development of fascicular VT. That said, I could not rule out the possibility of fascicular VT on the basis of this single tracing.

    • PEARL #5: Finding a copy of a prior ECG on today's patient could be the most time-efficient way to determine IF the regular WCT rhythm in Figure-1 was of a supraventricular etiology, as I suspected. If this were the case — the patient's baseline ECG during sinus rhythm would most likely manifest a very abnormal QRS morphology (similar to that seen in Figure-1) — as the result of longterm hypoxemia.  

    ==========================
    Today’s CASE Continues:
    Medical treatment of the WCT rhythm shown in Figure-1 — was not successful. As a result, synchronized cardioversion was performed — after which the post-cardioversion rhythm shown at the bottom of Figure-2 was obtained.


    QUESTIONS:
    • How would you interpret this post-cardioversion tracing?
    • Why does QRS morphology in ECG #2 change every-other-beat? How does this changing QRS morphology in ECG #2 confirm that the rhythm in ECG #1 is not VT?

    Figure-2: Comparison between today’s initial ECG — with the repeat ECG obtained following synchronized cardioversion (See text).

    The Post-Conversion Tracing in Figure-2:
    Sinus rhythm has been restored in the post-cardioversion tracing, at a rate of ~100/minute — as determined by the presence of huge, upright and pointed P waves with a constant and normal PR interval in front of each of the 17 beats in the long lead II rhythm strip.
    • PEARL #6: The fact that sinus P waves with the identical PR interval are seen in front of each beat in ECG #2 — confirms that the post-cardioversion rhythm is of sinus origin. This means that the changing QRS morphology every-other-beat must be the result of some alternating form of conduction defect.
    • NOTE: This changing QRS morphology in ECG #2 is more evident in some leads than in others (ie, While not so evident in lateral chest leads V4,5,6 of ECG #2 — the alternating QRS morphology is obvious in leads such as I, III, aVL, V1 and V3).

    PEARL #7: As unusual as QRS morphology is during the regular WCT rhythm in today's initial ECG — Compare this QRS morphology (within the dark BLUE rectangles in Figure-3) — to QRS morphology of odd-numbered beats in each of the 12-leads of the post-cardioversion tracing (within the light BLUE rectangles in Figure-3).
    • With the exception of minor differences — Isn't QRS morphology during the WCT — and, for odd-numbered beats after conversion to sinus rhythm, virtually the same?

    • KEY Point: This virtually-the-same QRS morphology during and after confirms that the regular WCT in today's initial tracing was not VT. Instead, it tells us that today's patient has an extremely abnormal "baseline" ECG.

    Figure-3: Comparison of QRS morphology during the WCT — and for odd-numbered beats after conversion to sinus rhythm (See text).


    What Kind of Conduction Defect?
    As is often emphasized on this ECG Blog (ie, See ECG Blog #204) — Rapid determination of the type of conduction defect is most easily (and most time-efficiently) determined by assessment of QRS morphology in 3 KEY leads ( = right-sided lead V1 — and left-sided leads I and V6).
    • PEARL #8: QRS morphology of odd-numbered beats in the post-cardioversion tracing (ie, within the light BLUE rectangles of ECG #2 in Figure-4) — is consistent with RBBB/LPHB conduction because: i) There is an rSR' complex with taller right rabbit ear in lead V1 — with wide terminal S waves in lateral leads I and V6; and, ii) The S wave in lead I is predominantly negative, with an extremely deep straight component to this S wave (See ECG Blog #203 for review on the rapid ECG diagnosis of the hemiblocks).

    • KEY Point: In contrast to the RBBB/LPHB conduction of odd-numbered beats in ECG #2 — even-numbered beats in Figure-4 show neither RBBB nor LPHB conduction! 

    Figure-4: I've labeled KEY findings in today's case.

    ==========================
    Putting It All Together:
    We finally have enough information to explain today's fascinating case:
    • This young man in his early 20s presented with an episode of acute dyspnea in a regular WCT rhythm at ~190/minute, without clear sign of sinus P waves.
    • Definitive ECG diagnosis was not possible on the basis of the single tracing shown in ECG #1. That said — physical exam findings of cyanosis and clubbing, together with the history of longstanding dyspnea episodes suggested more of a chronic problem (presmably the expression of Congenital Heart Disease in an adult) — rather than an isolated episode of VT in a young man.
    • In any event — the rhythm in ECG #1 mandated treatment before a definite ECG diagnosis was known. When a trial of medical therapy was unsuccessful — synchronized cardioversion was performed — with resultant conversion to sinus rhythm (as shown in ECG #2).

    • Proof that the unusual QRS morphology during the WCT rhythm was supraventricular — was forthcoming from the finding of nearly identical QRS morphology during the WCT rhythm — with QRS morphology of each odd-numbered beat after conversion to sinus rhythm.
    • This suggests that the reason for QRS widening during the initial ECG — was rate-related aberrant conduction (with a pattern of RBBB/LPHB conduction). After conversion to sinus rhythm in ECG #2 — the slower ventricular rate allowed for normal conduction with each even-numbered beat.

    • PEARL #9: That today's patient almost certainly has some form of severe CHD as the cause of his longstanding dyspnea episodes, cyanosis and clubbing — is evident from the exceedingly tall, peaked and pointed P waves (nearly 1 large box tall in lead II — as well as being markedly peaked in many of the chest leads — as seen within the RED ovals in ECG #2). In the context of today's case — these P waves are diagnostic of RAE = P Pulmonale (See ECG Blog #75) and almost certain associated pulmonary hypertension.

    • PEARL #10: Taking another LOOK at the initial ECG in today's case — atrial activity was evident during ECG #1 (in the form of retrograde P waves with a relatively long RP' interval — as highighted by YELLOW arrows in Figure-4). It is because of the marked RAE (Right Atrial Enlargement) that when conducted retrograde, these huge P waves simulated inferior lead T wave inversion during the WCT rhythm. Retrospectively — I interpret this 1:1 retrograde conduction as diagnostic of a reentry SVT rhythm as the etiology of the initial tachycardia. Given the relatively long RP' interval — there is a good chance that this patient has an AP (Accessory Pathway) — and that the type of SVT reentry is AVRT (See ECG Blog #240 — for complete review on distinction between AVNRT vs AVRT depending on retrograde conduction features).


    FINAL Thought: The underlying etiology of today's tachyarrhythmia, and this patient's principal problem — appears to be the expression of CHD in an adult.
    • As noted by Moodie in his manuscript on Adult Congenital Heart Disease (Tex Heart Inst J: 38(6):705, 2011) — there are now more people over the age of 20 with CHD than under that age!

    • Hopefully today's patient receives full evaluation for his CHD. 


    ==================================
    Acknowledgment: My appreciation to Abdullah Al Mamum (from Dhaka, Bangladesh) for the case and this tracing.
    ==================================


    ==============================

    Additional Relevant ECG Blog Posts to Today’s Case:

    • ECG Blog #185 — Reviews my System for Rhythm Interpretation, using the Ps, Qs & 3R Approach.

    • ECG Blog #210 — Reviews the Every-Other-Beat (or Every-Third-Beat) Method for estimation of fast heart rates — and discusses another case of a regular WCT rhythm. 

    • ECG Blog #220 — and ECG Blog #361 — Review of the approach to the regular WCT ( = Wide-Complex Tachycardia).
    • ECG Blog #196 — Reviews another Case with a regular WCT rhythm.
    • ECG Blog #263 and Blog #283 — More WCT Rhythms ...

    • ECG Blog #197 — Reviews the concept of Idiopathic VT, of which Fascicular VT is one of the 2 most common types. 
    • ECG Blog #346 — Reviews a case of LVOT VT (a less common idiopathic form of VT).

    • ECG Blog #204 — Reviews the ECG diagnosis of the Bundle Branch Blocks (RBBB/LBBB/IVCD). 
    • ECG Blog #203 — Reviews ECG diagnosis of Axis and the Hemiblocks. For review of QRS morphology with the Bifascicular Blocks (RBBB/LAHB; RBBB/LPHB) — See the Video Pearl in this blog post.
    • ECG Blog #211 — WHY does Aberrant Conduction occur?

    • ECG Blog #301 — Reviews a WCT that is SupraVentricular! (with LOTS on Aberrant Conduction).

    • ECG Blog #323 — Review of Fascicular VT. 
    • ECG Blog #38 and Blog #85 — Review of Fascicular VT.
    • ECG Blog #278 — Another case of a regular WCT rhythm in a younger adult.
    • ECG Blog #361 — A regular WCT in a middle-aged man.
    • ECG Blog #35 — Review of RVOT VT. 
    • ECG Blog #42 — Review of criteria for distinguishing VT vs aberrant conduction.

    • ECG Blog #133 and ECG Blog #151— for examples in which AV dissociation confirmed the diagnosis of VT.
    • Working through a case of a regular WCT Rhythm in this 80-something woman — See My Comment in the May 5, 2020 post on Dr. Smith’s ECG Blog. 
    • Another case of a regular WCT Rhythm in a 60-something woman — See My Comment at the bottom of the page in the April 15, 2020 post on Dr. Smith’s ECG Blog. 

    • Review of the Idiopathic VTs (ie, Fascicular VT; RVOT and LVOT VT) — See My Comment at the bottom of the page in the September 7, 2020 post on Dr. Smith’s ECG Blog.
    • Review of a different kind of VT (Pleomorphic VT) — See My Comment in the June 1, 2020 post on Dr. Smith’s ECG Blog.