Tuesday, April 19, 2022

ECG Blog #299 — Unresponsive and an Acute MI?


The ECG shown in Figure-1 is from a woman in her 60s. There was sudden loss of consciousness.

QUESTIONS: 
  • Should the cath lab be activated?
  • What is the rhythm?

Figure-1: The initial ECG in Today's Case (See text).


MY Thoughts on the ECG in Figure-1:

The patient was unresponsive at the time ECG #1 was recorded. I first looked at the rhythm. As per ECG Blog #185 — By the Ps, Qs, 3R approach:

  • The rhythm in the long lead II at the bottom of the tracing is fast and irregular.
  • Beats #7 and 16 are clearly wider and different-looking than the other beats on the tracing. These 2 beats are PVCs (Premature Ventricular Contractions).

  • Although I initially thought the QRS complex was wide everywhere — on closer inspection (except for beats #7 and 16) — the vertical dotted BLUE lines that I have added in simultaneously-recorded leads for each of the lead groups (in Figure-2) — verify that the QRS complex for all other beats on this tracing is narrow. Instead — it is the presence of marked "Shark-Fin" ST elevation that accounts for the mistaken appearance that the QRS is wide — when in fact the QRS is narrow (See ECG Blog #265 — for review of Shark Fin ST elevation).

  • By the Ps, Qs, 3R approach — this leaves us with having to account for atrial activity. Once again — my initial impression that P waves are present in front of many QRS complexes was not necessarily accurate. It is the presence of gross baseline artifact that makes rhythm assessment so difficult in this tracing (this artifact being most marked in leads III and aVF — but present to some extent throughout).

  • CONFESSION: I still am not certain what the rhythm in ECG #1 is. Certain beats (ie, beat #17 — especially if you look at this beat in simultaneously-recorded lead V1) — clearly look as if they are preceded by sinus P waves with a normal PR interval (The rhythm in lead V1 looks like a slightly irregular sinus tachycardia with a PVC for beat #16).
  • That said — the overall rhythm in the long lead II is clearly irregular — and coarse "fib waves" appear to be present during the post-ectopic pause between beats #7-to-8 (as well as in the shorter R-R intervals after beat #3 and after beat #17 in the long lead II rhythm strip). Additional coarse fib waves plus artifact appear to be present in lead III.

  • BOTTOM LINE: I suspect that the rhythm in ECG #1 is rapid AFib (Atrial Fibrillation). That said, even now — I am still not certain about the rhythm diagnosis. Clinically, however — the rhythm was less of a concern at the bedside than the marked "Shark-Fin" ST elevation that is present in multiple leads (ie, leads I, II, aVL; V2-thru-V6). Did the cath lab need to be activated?


Figure-2: I've labeled Figure-1 with vertical dotted BLUE lines in simultaneously-recorded leads, to clarify where the QRS complex ends.


CASE Follow-Up:
First priority in this case was to stabilize the patient. The patient was intubated, vital signs were stabilized — and the ECG was repeated (Figure-3). The patient remained unresponsive.


Figure-3: The repeat ECG that was obtained after the patient was intubated and stabilized (about 1 hour after ECG #1 had been done).


Comparison of the Repeat & Initial ECGs:
The repeat ECG in Figure-3 shows sinus rhythm at a much slower and regular heart rate (of ~70/minute). The PR interval is normal.
  • The QRS complex in ECG #2 is clearly of normal duration. This confirms the measurements I suggested for QRS duration by the dotted BLUE lines drawn in Figure-2. Of interest — except for a slight frontal plane axis shift and somewhat increased QRS amplitude in a number of leads — QRS morphology in ECG #2 is similar to QRS morphology in ECG #1.

  • The QTc is prolonged. One should measure intervals in whatever lead clearly shows the onset and offset of the interval, and in which the interval is longest. I measure the QT interval to be ~460 milliseconds in lead V2 of ECG #2 — which for a heart rate of ~70/minute — corrects for a QTc ~480 msec.

  • Otherwise — the axis in ECG #2 is normal (about +40 degrees) — and, there is now voltage for LVH (very tall R waves in the lateral chest leads). There is still J-point ST elevation in multiple leads, with straightening of the ST segment takeoff (if not ST segment coving i leads V2, V3). That said — the amount of ST elevation is markedly reduced in ECG #2 compared to what was seen in the initial ECG!


CASE Follow-Up:
Given the patient's sudden unresponsive state — a non-contrast Brain CT Scan was ordered — the results of which are shown in Figure-4:
  • The subarachnoid (or basal) cisterns are compartments within the subarachnoid space where the pia mater and arachnoid membrane are not in close contact with each other — such that CSF (CerebroSpinal Fluid) may "pool" in these spaces. As these cisterns are all interconnected — circulation of CSF depends on their patency. 
  • YELLOW arrows in Figure-4 highlight a few of the hyperdense (light gray) areas within the cisterns and other areas in the brain where there is blood in the subarachnoid space.
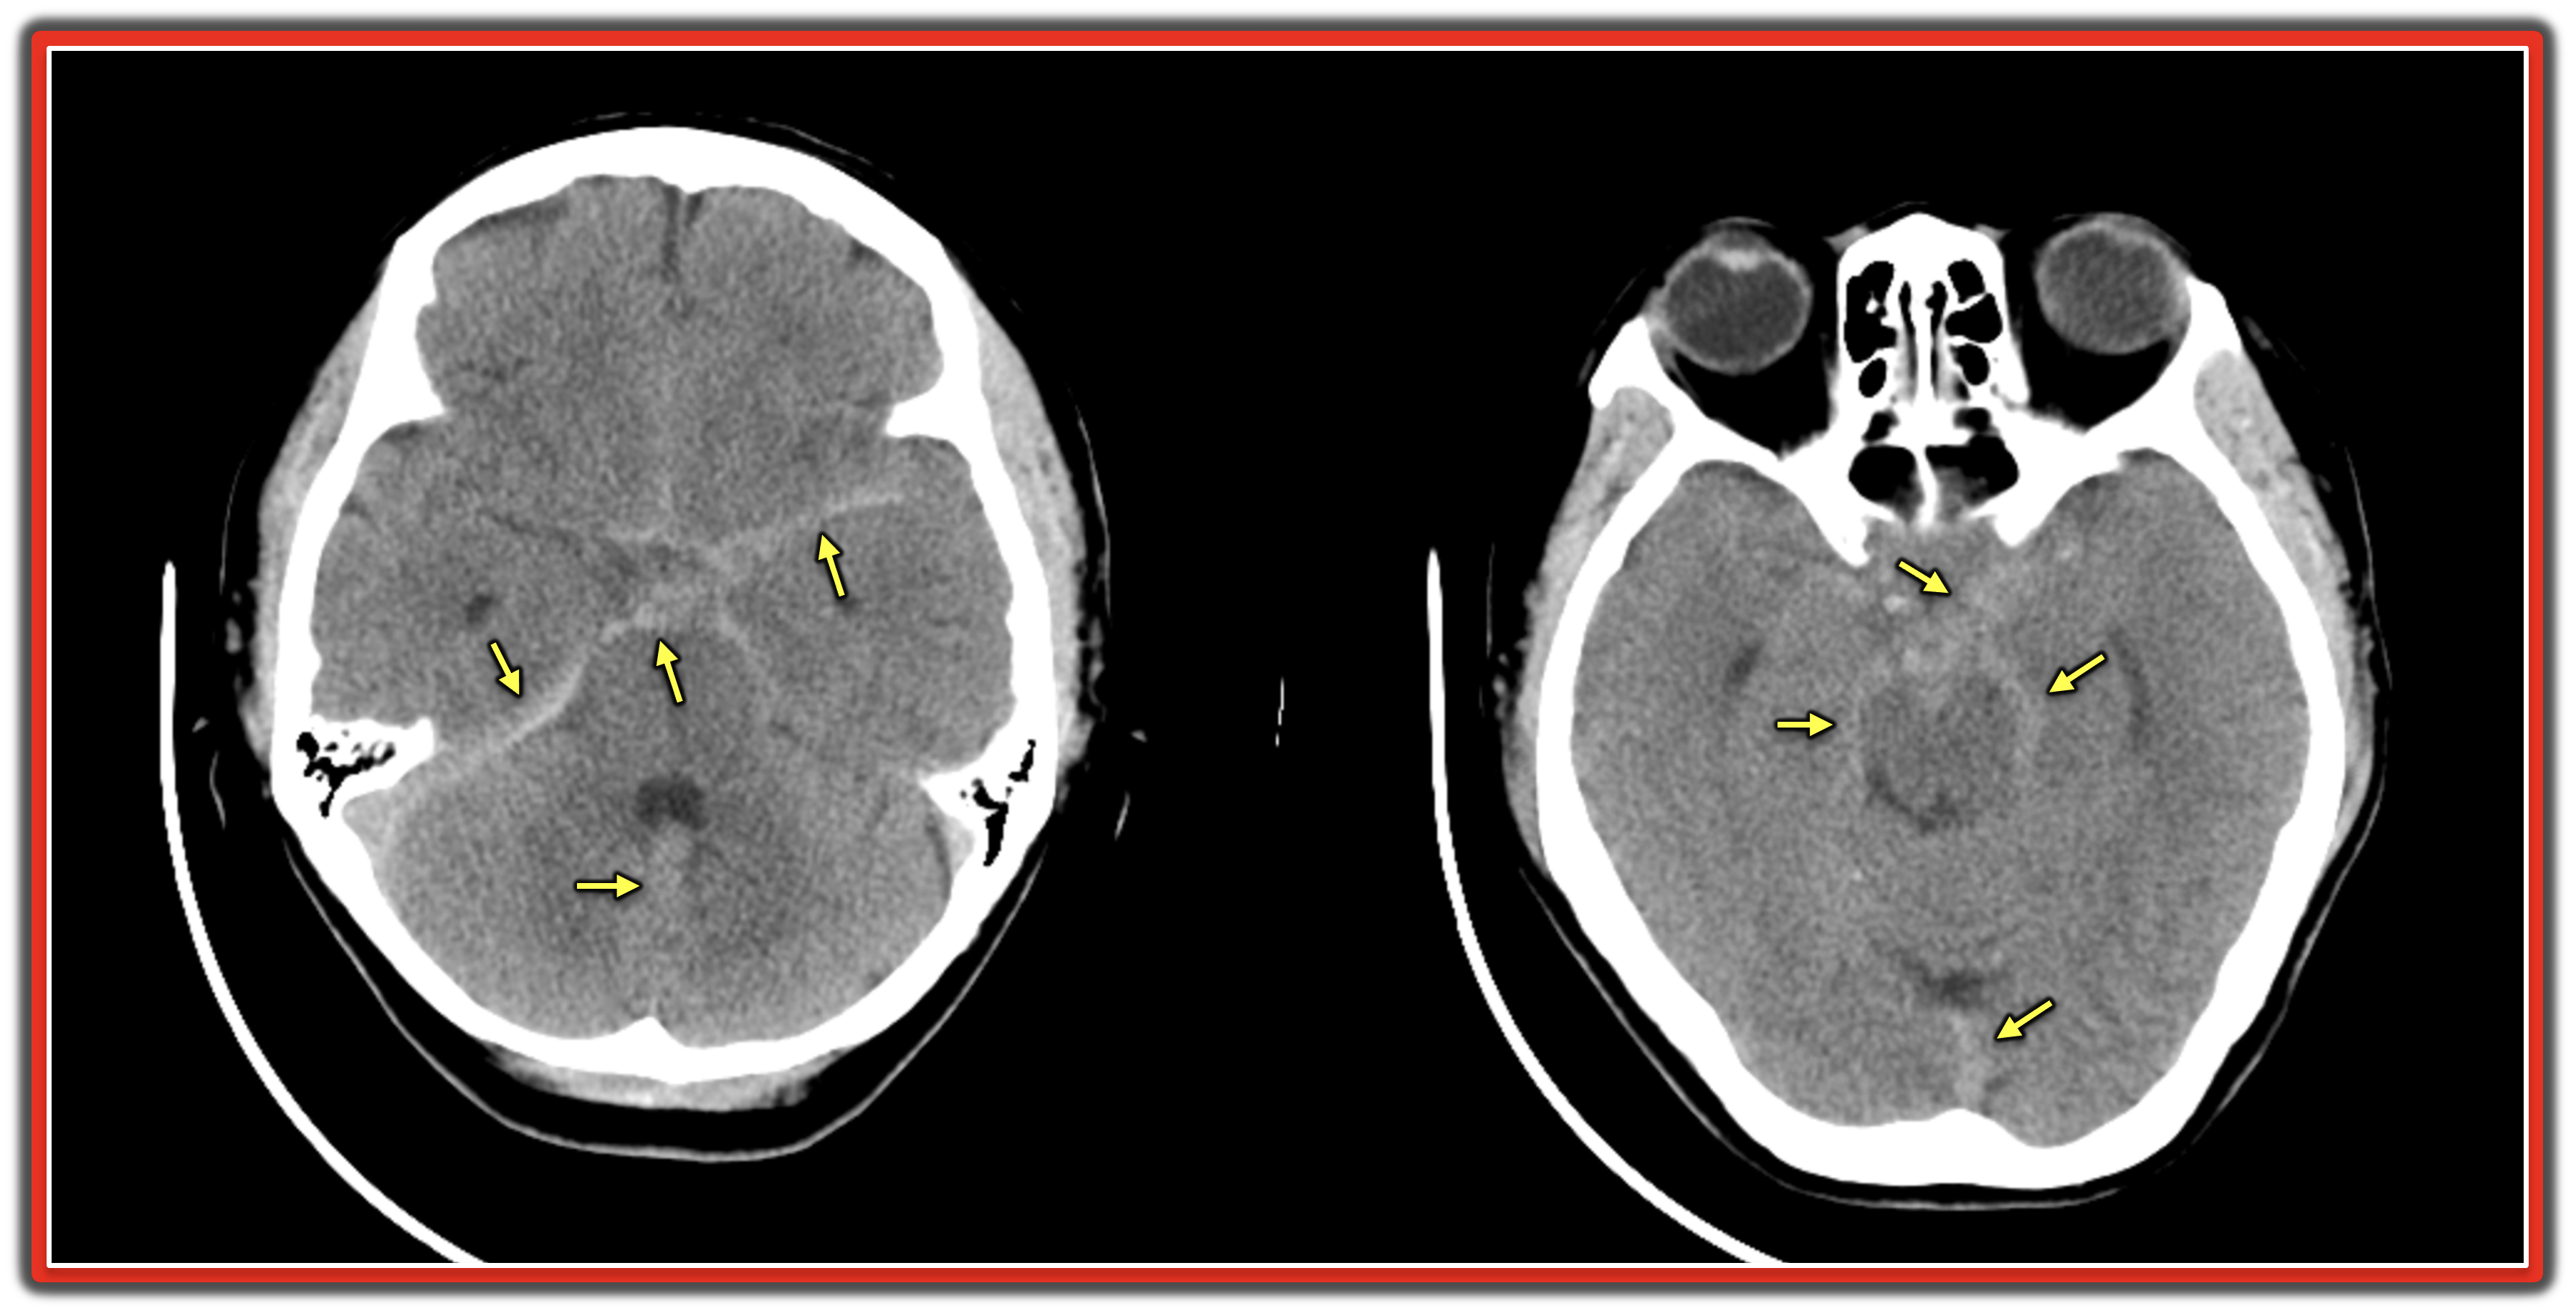

Figure-4: Non-contrast CT scan showed multiple areas of hyperdensity (light gray areas) — reflecting a large amount of blood in the subarachnoid space (YELLOW arrows highlight a few of these hyperdense areas).


ECG Changes in SAH (SubArachnoid Hemorrhage):
There has long been literature documentation of ECG abnormalities with CNS catastrophes — which are often particularly marked in association with SAH (Chatterjee — Neth Heart J 19:31-34, 2011) — (Saritemur et al — Am J Emerg Med 31:271.e5, 2013) — (Park et al — Clin Exp Emerg Med 2:260-263, 2015).
  • ECG abnormalities encompass QTc prolongation — development of large U waves — plus — ST elevation and/or T wave inversion that on occasion may be accompanied by reciprocal ST depression in leads opposite the ST elevation. 

  • Cardiac arrhythmias are also common with SAH — including bradycardia — AFib — frequent PVCs — VT/VFib — and Torsade de Pointes (especially if the QTc is significantly prolonged).

  • Among the proposed mechanisms accounting for ECG abnormalities associated with SAH are: i) Hypothalamic stimulation; and, ii) Autonomic dysfunction with resultant catecholamine surge.

  • NOTE: ECG abnormalities associated with SAH tend to be most marked within the first 48-72 hours after onset of this neurologic event. Troponin may be elevated with SAH (usually not by a large amount — but enough to confuse the issue) — and regional wall motion abnormalities may be seen due to neurogenic stunned myocardium.

  • Clinical implications for being aware of SAH as an important cause of "Pseudo-Infarction Patterns" to consider, are obvious from today's case — in which consideration was initially given to activating the cath lab. Doing so would not only subject the patient to an unnecessary invasive procedure — but would further delay diagnosis of the real cause of ECG abnormalities (ie, SAH). Cardiac cath was not done given the patient's overall clinical condition.

  • SAH is not uncommonly associated with out-of-hospital cardiac arrest. In such cases — the patient will most often still be unresponsive on arrival in the Emergency Department. It is easy to imagine how confusion as to the cause of patient collapse might arise when the initial ECG shows a pseudo-infarction pattern from unsuspected SAH.

  • Take-Home Message: In an unresponsive, resuscitated patient — SAH should be considered as a possible cause of cardiac arrest regardless of whether or not the ECG suggests an acute STEMI.


====================================
Did YOU Recognize the Spiked Helmet Sign?
The final interesting ECG sign seen in today's case is the Spiked Helmet Sign (See Figure-5).
  • First described by Littman in 2011 (Letter to Mayo Clin Proc: 86 (12): 1245, 2011) — the Spiked Helmet Sign ( = SHS) is an uncommon and unique electrocardiographic finding, that is seen in patients with acute critical illness (such as the sudden loss of consciousness, as occurred in this case). The sign is typically associated with a high mortality. In addition to extensive acute MI, Takotsubo Cardiomyopathy, and cardiac arrest — other conditions that have been associated with SHS include intracranial hemorrhage, sepsis, severe metabolic disorders. Many other critical care conditions will doubtlessly be added to this list — as recognition of this important ECG sign becomes more widespread.
  • As shown for the insert in the lower righ part of Figure-5 — the name of this “dome-and-spike” pattern is derived from the Pickelhaube, a spiked helmet worn in the 19th and 20th centuries by Prussian and German soldiers, as well as by policemen and firemen. (The literal translation of “Pickelhaube” in German = “pointe” or “pickaxe” for Pickel — and “bonnet” for Haube.).

  • As described by Crinion, Abdollah & Baranchuk (Circulation 141:2106 — June 23, 2020) — the QRS-ST segment with the Spiked Helmet Sign is characterized by 3 specific components: i) Some elevation of the isoelectric line that begins before the QRS complex (ie, making up the first half of the helmet); ii) Then sharp ascent of the R wave (ie, the “spike” in the helmet); and finally; iii) Coved ST elevation of varying degree, that may mimic an acute ST elevation MI (ie, the second half of the helmet).
  • One, two, or all 3 of these components may be seen in one or more leads on the ECG. Although initial reports limited the occurrence of this finding to the inferior leads — any of the 12 leads on an ECG may be affected!

  • The proposed mechanism is fascinating — namely, a hyperadrenergic state with adrenergically mediated prolongation of repolarization. The reason for elevation of the isoelectric line beginning before the QRS complex — may result from similar pathophysiology as is seen in conditions with marked QT (and/or QU) prolongation — with the late and enlarged T and U waves being superimposed on the initial portion of the QRS. Other features shared with excessive endogenous catecholamine states such as long QT syndrome, Takotsubo Cardiomyopathy and CNS hemorrhage — include Torsades de Pointes, T wave alternans, and pseudo-infarct ST elevation.

  • PEARL — As noted above, the Spiked Helmet Sign (SHS) may produce ST elevation that might easily be mistaken for an acute STEMI. However, distinction from a STEMI can often be made by recognizing the upward shift of the isoelectric line that begins before the QRS complex — and which often comes close to “lining up” with the ST elevation seen after the QRS. This distinguishing feature is best illustrated within the PURPLE rectangle in the Spiked Helmet insert in the lower right part of Figure-5. 
  • Further support that the ST elevation pattern of SHS is not the result of acute infarction may be forthcoming from atypical distribution of the QRS-ST segment changes on the 12-lead ECG — and lack of the typical evolutionary pattern of ECG changes seen with true STEMI.

  • Returning to the initial ECG in today's case — I've outlined in RED in Figure-5 the features of the Spiked Helmet Sign that are seen in a number of leads in ECG #1. Although the pre-QRS elevation component of SHS is admittedly subtle — Isn't the pointed spikes with associated marked ST elevation and coving seen in multiple leads striking?

Figure-5: Features of the Spiked Helmet Sign that are seen in multiple leads in the initial ECG from today's case. The insert with the spiked helmet is from Laszlo Littmann’s 2011 Letter to Mayo Clinic Proceedings (See text). I have previously used this insert Figure to illustrate another case of SHS, in My Comment from the June 28, 2020 post of Dr. Smith's ECG Blog.


==============================

Acknowledgment: My appreciation to 陳俊宏 (Chun-Hung Chen from Taichung City, Taiwan) for the case and this tracing.

==================================


Related ECG Blog Posts to Today’s Case: 

  • ECG Blog #185 — Reviews my System for Rhythm Interpretation, using the Ps, Qs & 3R Approach.
  • ECG Blog #205 — Reviews my Systematic Approach to 12-lead ECG Interpretation (outlined in Figures-2 and -3, and the subject of Audio Pearl MP-23-LINK in Blog #205).

  • ECG Blog #265 — which reviews in detail a case of "Shark Fin" ST elevation due to ischemia/infarction from CO poisoning.
  • The November 22, 2019 post in Dr. Smith's ECG Blog — My Comment (at the bottom of the page) adds to this case, in which there was cardiac arrest, ischemic Osborn waves, with massive Shark Fin ST deviation from acute STEMI.
  • The June 11, 2018 post in Dr. Smith's ECG Blog — My Comment (at the bottom of the page) adds to this case, in which there was an underlying Bifascicular Block (RBBB/LPHB), in addition to Shark Fin ST elevation & depression. 
  • The January 24, 2020 post in Dr. Smith's ECG Blog — My Comment (at the bottom of the page) adds to this case, in which there was an underlying Bifascicular Block (RBBB/LAHB), in addition to Shark Fin ST elevation & depression — followed by progressive Low Voltage due to Myocardial Stunning from the huge infarct.


Friday, April 15, 2022

ECG Blog 298 — RBBB and Anything Else?


The patient is an elderly woman who presented to the ED (Emergency Department) with chest pain — and the ECG shown in Figure-1.  
  • There is RBBB (Right Bundle Branch Block). Is there anything else?

Figure-1: ECG from an elderly woman with chest pain (See text).


MY Initial Impression ( = the “Quick” Version):

In the interest of conveying how fast we can arrive at a presumed diagnosis — Here is my “Quick Verson” assessment of today’s tracing:

  • The rhythm is sinus tachycardia at ~115/minute (ie, regular rhythm with upright sinus P waves in lead II).
  • The PR interval is normal — but the QRS is obviously prolonged (ie, clearly more than half a large box in duration = ≥0.11 second). BEST to “Stop!” one’s systematic approach as soon as QRS widening is recognized — in order to determine WHY the QRS is wide before proceeding further.
  • The typical RsR’ triphasic QRS complex in right-sided lead V1 with wide terminal S waves in lateral leads I and V6 is diagnostic of RBBB (Right Bundle Branch Block).
  • The predominantly negative QRS in each of the inferior leads is diagnostic of LAHB (Left Anterior HemiBlock).


NEXT: Now that we’ve determined WHY the QRS is wide in Figure-1 (ie, because of RBBB/LAHB) — I resumed my “Rapid” assessment:
  • Abnormal Q waves are seen in leads I and aVL (ie, these Q waves being clearly wider-than-they-should-be — given modest R wave amplitude in these leads).
  • Although the shape of the ST-T wave in lead V1 is typical for RBBB — it is definitely not typical in leads V2, V3 and V4. Instead — there is marked J point ST depression in leads V2, V3, V4 (which is maximal in lead V2) — followed by a distinctly abnormal straightening of the ST segment that rises slow (instead of initially descending, as it does for the ST-T wave in lead V1). This ST segment shape is characteristic of acute posterior OMI (Occlusion-based MI).

  • Looking at Other Leads: I do not see ST elevation in any leads. Instead — I see nonspecific ST-T wave flattening in most of the other leads.

  • IMPRESSION of ECG #1: Sinus tachycardia at ~115/minute. Bifascicular Block (ie, RBBB/LAHB). Abnormal high-lateral Q waves (in leads I, aVL). Acute posterior OMI until proven otherwise. The “culprit” artery with acute isolated posterior MI (or acute postero-lateral MI) — will most often be the LCx (Left Circumflex) coronary artery.


========================

LEARNING POINTS:

  • POINT #1: How do we know that the anterior ST depression in ECG #1 represents acute posterior MI — and is not simply from the RBBB?


ANSWER: the shape of ST depression that is normally seen in anterior leads with RBBB is slowly downsloping. It is not straightened, as seen in leads V2,V3,V4 of Figure-1. 
  • Even more specific to the diagnosis of posterior MI — ST depression from simple RBBB will decrease as you move from lead V1-to-V2-to-V3 — eventually disappearing as you move to more lateral chest leads. The depth of J-point ST segment depression should not increase as you move away from lead V1 — as it does in ECG #1 between lead V1 and lead V2. 
  • KEY Point: Acute posterior OMI is characterized by ST depression that is maximal in lead V2, V3 and/or V4 — just as is seen in ECG #1.


========================

  • POINT #2: How do we know that the Q waves we see in leads I and aVL of ECG #1 are “pathologic” — and not simply normal septal q waves?


ANSWER: It is common to see small and narrow “normal septal q waves” in one or more lateral leads (ie, in leads I, aVL, V4,V5,V6). Complete RBBB does not eliminate these normal septal q waves.
  • Septal activation normally moves from the left-to-the-right side of the septum. Since the conduction defect with RBBB is on the right (not the left) side of the septum — the initial left-to-right vector of septal activation (during which time septal q waves are written) will remain intact with RBBB. 
  • How big is “too big” for a lateral q wave to be physiologic is hard to define. That said — in view of the acute situation for today’s case (ie, new chest pain in a patient with ongoing acute posterior OMI) — I interpreted the Q waves in both high-lateral leads (I, aVL) as being disproportionately tall and wide considering the very modest R wave amplitude in these leads. 
  • NOTE: It is common for the high-lateral wall to be involved with LCx lesions that cause acute posterior OMI.


========================

  • POINT #3: How do we diagnose a Hemiblock when there is BBB (Bundle Branch Block)? 


ANSWER: The diagnosis of either LAHB or LPHB does not make sense when there is LBBB. In contrast — with RBBB, there can also be either LAHB or LPHB (in which case there will be a Bifascicular Block). 
  • By definition, when there is LBBB — there is non-conduction through the left bundle branch system. As a result — there is impaired conduction through both the left anterior and left posterior hemifascicles. To say there is “LBBB plus LAHB” is therefore redundant (because "LBBB" already implies there is both LAHB and LPHB). 
As discussed in the ECG Videos in the Addendum below — the shortcut to diagnosis of the Bifascicular Blocks — is to realize that there are only 3 possible situations:
  • i) RBBB + LAHB (ie, in addition to RBBB — the QRS will be predominantly negative in each of the inferior leads). This is precisely the situation in today's tracing!
  • ii) RBBB + LPHB (ie, in addition to RBBB — the QRS in lead I will display a very steep and very deep S wave descent).
  • iii) RBBB without any hemiblock (ie, if neither lead I nor the inferior leads manifest predominant negativity).


========================

Case CONCLUSION:
Unfortunately — I lack details regarding specific management of this case beyond knowing that positive troponin confirmed acute infarction.
  • Given the older age of today's patient (and the lack of a prior tracing for comparison) — it is unknown whether the high-lateral Q waves and the RBBB/LAHB are "new" (this bifascicular block combination is more common with acute LAD rather than LCx occlusion).
  • Regardless — the "Take-Home" Message is that in a patient with new symptoms, today's ECG is absolutely diagnostic of acute posterior OMI.


=======================
Acknowledgment: My appreciation to M Shah (from Srinagar, India) for the case and this tracing.

=======================


==================================


Related ECG Blog Posts to Today’s Case:

  • ECG Blog #205 — Reviews my Systematic Approach to 12-lead ECG Interpretation.

  • ECG Blog #193 — illustrates use of the Mirror Test to facilitate recognition of acute Posterior MI. This blog post reviews the basics for predicting the "culprit" artery. (NOTE: Figure-2 in the Addendum below illustrates the essentials for identifying an isolated posterior MI).

  • ECG Blog #246 — for another example of acute Posterior MI (with positive Mirror Test).
  • ECG Blog #80 — reviews prediction of the "culprit" artery (and provides another case illustrating the Mirror Test for diagnosis of acute Posterior MI).
  • ECG Blog #285 — Reviews another acute Posterior MI.

  • ECG Blog #258 — How to "Date" an Infarction based on the initial ECG.

  • ECG Blog #204 — Reviews the ECG diagnosis of the Bundle Branch Blocks (RBBB/LBBB/IVCD). 
  • ECG Blog #203 — Reviews ECG diagnosis of Axis and the Hemiblocks. For review of QRS morphology with the Bifascicular Blocks (RBBB/LAHB; RBBB/LPHB).

  • ECG Blog #221 — Reviews a case of RBBB in the context of HOW to diagnose acute MI when there is BBB.


==================================  
ADDENDUM (4/12/2022): 

I've added below selected media material that reviews KEY concepts related to today's case.


Figure-2: KEY points in the recognition of isolated posterior MI (This figure is taken from ECG Blog #193 — in which I review the "Basics" for predicting the "culprit" artery).


=======================================

NOTE: For those who want a user-friendly video review illustrating how to diagnose the Bundle Branch Blocks in less than 5 seconds:


    ECG Media Pearl #22 (13:15 minutes Video) — ECG Blog #204 — Reviews a user-friendly approach for how to diagnose Bundle Branch Blocks (RBBB/LBBB/IVCD) in a matter of seconds! — also ECG Blog #282 —

    • CLICK HERE — for FREE download PDF of this 26-page file on BBB (from my ECG-2014-ePub) — with review on the Basics for ECG diagnosis of the Bundle Branch Blocks (including diagnosis of acute MI & LVH with BBB).

    ================================== 


    ECG Media Pearl #21 (12:00 minutes Video) — ECG Blog #203 — User-friendly approach to the Hemiblocks (LAHB/LPHB) and Bifascicular Blocks (RBBB/LAHB- RBBB/LPHB).


    Today’s ECG Media PEARL #38 (11:30 minutes Audio) — Reviews the ECG Diagnosis of Acute MI when there is BBB.


    Monday, April 11, 2022

    ECG Blog #297 — Is this VT?


    The ECG in Figure-1 was obtained from an older man with a chief complaint of chest pressure and shortness and breath for the past several days. He was hemodynamically stable at the time the tracing in Figure-1 was recorded.
    • Is this VT (Ventricular Tachycardia)?
    • How certain are you of your answer?

    Figure-1: ECG obtained from an older man with chest pressure and shortness of breath.


    =================================
    NOTE: For optimal clinical utility — I’ve divided my comments into 2 parts: i) My initial rapid assessment (that I completed within seconds of seeing this tracing); and, ii) My 2nd (more detailed) assessment of this tracing — with greater attention to specific ECG findings:
    • The “good news” — is that the patient in today’s case was hemodynamically stable at the time the ECG in Figure-1 was recorded. Therefore, by definition — this gives us at least a “moment of time” to assess the rhythm without need for immediate cardioversion. 


    My Initial Rapid Assessment (Completed within Seconds! ):
    By the Ps, Qs, 3R Approach (ECG Blog #185):
    • The rhythm is Rapid (clearly over 200/minute) — and Regular. The QRS complex looks wide (albeit not very wide) — and I do not see sinus P waves. Therefore — the rhythm in Figure-1 is a regular WCT ( = Wide-Complex Tachycardia), but without clear sign of atrial activity.
    • KEY Point: Even before looking at morphologic features — statistical odds are at least 80% that an older patient in a regular WCT rhythm without clear sign of atrial activity will turn out to be in VT. (These odds probably exceed 90% if this patient has underlying heart disease).

    • NEXT Step: I favor the “3-Simple Rules” for rapid distinction between VT vs SVT rhythms (See ECG Blog #196 — including the Audio Pearl in this post, for more on this topic). The fact that there is “extreme” axis deviation in Figure-1 (ie, an all negative QRS complex in lead aVF) — and an almost all negative QRS in lateral chest lead V6 — further increase statistical likelihood that this WCT rhythm is VT. That said — There are 2 ECG findings against this rhythm being VT: i) That QRS widening is minimal; and, ii) The initial portion of the QRS complex in multiple leads manifests rapid depolarization (ie, extremely steep S wave descent in virtually every lead with a predominantly negative QRS complex).

    • BOTTOM Line: Statistical likelihood (for this patient who is an older man) — that the regular WCT rhythm in Figure-1 will turn out to be VT is at least 90%. While it should be emphasized that 90% is not the same as 100% — We need to assume VT (and treat the patient accordingly) — until proven otherwise.


    More Detailed Assessment about Today's Case:
    • The rate of the rhythm in Figure-1 is extremely fast. There are a number of ways to rapidly estimate very fast heart rates (See ECG Blog #210 — and ECG Blog #278 for detailed illustration of my Every-Other-Beat Method). The R-R interval for today's rhythm is just over 1 large box in duration — which corresponds to a heart rate ~240/minute.

    • We are told that today's patient was “hemodynamically stable” at the time the ECG in Figure-1 was recorded. However, this patient is “older” — the ventricular rate of this WCT rhythm is extremely fast (~240/minute) — and the patient was having symptoms (ie, “chest pressure" and "shortness of breath”) at the time this ECG was recorded. This raises the question: Was this patient truly hemodynamicaly stable?
    • I have always felt that in such cases, “Ya Gotta Be There” in order to optimally assess hemodynamic stability (See ECG Blog #220 — for full discussion of this subject). While it may have been reasonable to initially opt for a trial of medical therapy — we need to recognize that at best, this patient’s “hemodynamic stability” is borderline. IF at any point during the treatment process the patient's condition worsens — prompt cardioversion will be needed.

    • It is sometimes difficult to accurately assess QRS duration at the bedside of a symptomatic patient in a very rapid arrhythmia. In Figure-1 — the QRS actually looks narrow in a number of leads (ie, in leads I, aVL, V1 — and in some of the leads with predominantly negative QRS complexes). Remember: QRS duration should be measured in that lead in which you can clearly see the beginning and end of the QRS complex — and in which the QRS looks widest! If we select lead aVR in Figure-1 — the QRS definitely looks wide!

    • It may also be difficult to assess atrial activity in rapid arrhythmias. We are looking for a number of different types of atrial activity: i) Are there sinus P waves? (ie, clearly upright P waves in lead II?); ii) Are there retrograde P waves? (ie, P waves that regularly occur after the QRS — and which are negative in the inferior leads, but positive in leads like aVR and V1?); iii) Are there "fib" waves? — "flutter" waves? — or other evidence of atrial activity?; and/or, iv) Do we see AV dissociation?

    • PEARL #1: Although the finding of AV Dissociation can provide strong support that a regular WCT rhythm is VT (See ECG Blog #217) — it is very difficult to identify AV dissociation when the rate of the WCT rhythm is fast. In my experience, many clinicians think they see "AV dissociation" — when in fact, no reliably regular underlying sinus rhythm can be found. This may lead to misdiagnosis. It's best not to call AV dissociation unless you can reliably demonstrate (ie, with calipers) a reproducibly regular underlying sinus rhythm amidst the wide complexes of the tachycardia.
    • I do not see sinus P waves in Figure-1. I do not see clear evidence of retrograde atrial activity. The only possible indication of atrial activity that I see, is a small deflection following the QRS complex in lead V1. Given that I do not see this activity in other leads (and given that even if present, I cannot distinguish if this represents a positive or negative deflection) — I did not include this deflection in my assessment of the rhythm (because it does not provide diagnostic value).

    • BOTTOM Line: Even after more careful analysis — I was left with the same conclusion: Statistical likelihood that the regular WCT rhythm in Figure-1 will turn out to be VT is at least 90%. While 90% is not the same as 100% — We need to assume VT (and treat the patient accordingly) — until proven otherwise.

    • P.S. — If the rhythm in Figure-1 did turn out to be supraventricular (statistically unlikely — but possible) — I thought the most likely diagnosis would then be a reentry SVT rhythm (ie, AVNRT or orthodromic AVRT) — since AFlutter rarely presents with 1:1 AV conduction.


    Follow-Up: The Case Continues:
    The patient was treated with 1 dose of Adenosine without effect. Amiodarone was started — and several minutes later ECG #2 was obtained (bottom tracing in Figure-2).
    • How would YOU interpret the repeat ECG?
    • Does ECG #2 explain what the rhythm in ECG #1 was?
    •    HINT: Look closely again for atrial activity in both tracings!

    Figure-2: Comparison between the initial ECG — and the repeat ECG after a dose of Adenosine and beginning Amiodarone.


    ANSWER:
    The ventricular rate has significantly slowed in ECG #2 (from ~240/minute — to ~115/minute in ECG #2). The sawtooth pattern of AFlutter (Atrial Flutter) can now be seen in each of the inferior leads.
    • The rhythm in ECG #2 is AFlutter with 2:1 AV conduction. Since the ventricular rate is 115/minute — the atrial rate is 2X 115 — or about 230/minute.

    • Note that QRS morphology in each of the 12 leads in ECG #2 looks almost identical to QRS morphology in the initial tracing (except for the QRS looking slightly narrower in ECG #2).


    QUESTION:
    • What about atrial activity in both tracings? (See Figure-3).

    Figure-3: I've magnified leads V1,V2 in both tracings — with focus on the appearance of atrial activity (See text).


    ANSWER:
    The fact that QRS morphology is virtually identical in both ECG #1 and ECG #2 — confirms that the rhythm was supraventricular — and not VT.
    • Despite the final diagnosis — assuming the rhythm in ECG #1 was VT, and treating accordingly was the appropriate approach to initial management! We were not 100% certain about our diagnosis from Figure-1 — but we often have to begin management before knowing with certainty the etiology of the rhythm you are treating.
    • Treatment with both Adenosine and Amiodarone was appropriate in this case. The fact that the QRS complex was only minimally widened in ECG #1 suggests that IF the rhythm was VT — that it might be a form of idiopathic VT (ie, VT in the absence of underlying heart disease) — and some idiopathic VTs do respond to Adenosine (See ECG Blog #197). And if instead, the rhythm was supraventricular — then it should be either converted or temporarily slowed by Adenosine.
    • The advantage of IV Amiodarone as a treatment measure — is that it may effectively treat both ventricular and supraventricular tachyarrhythmias.

    • As to the question of atrial activity? — Slanted RED lines in the long lead II rhythm strip in ECG #2 highlight the 2:1 sawtooth pattern of AFlutter. Look at the RED arrows in lead V1 of this tracing.

    • Isn't the morphology of flutter waves (RED arrows) in lead V1 of ECG #2 the same as the morphology of the deflection highlighted by the BLUE arrows in lead V1 of the initial ECG?

    • PEARL #2: I did not initially realize that the deflection I was seeing in ECG #1 (BLUE arrows) represented 1:1 flutter activity! Sometimes the etiology of an arrhythmia will only become apparent after conversion to sinus rhythm, when you compare the "during" and "after" tracings. I found today's case fascinating — because it turns out that the initial rhythm in Figure-1 was AFlutter with 1:1 AV conduction! It is rare to see 1:1 AV conduction in a patient with AFlutter who is not on antiarrhythmic medication, and who does not have an accessory pathway.

    • PEARL #3: Despite a QRS morphology for the initial WCT rhythm in Figure-1 that strongly suggested the rhythm was VT (ie, extreme frontal plane axis — all positive QRS in lead aVR — almost all negative QRS in lead V6) — it turned out that the rhythm was supraventricular. Therefore — As helpful as QRS morphology may be for assessment of regular WCT rhythms — it is not perfect for distinguishing between VT vs SVT rhythms.

    • P.S.: Since we calculated the ventricular rate for the rhythm in ECG #1 to be ~240/minute — and since we determined this rhythm was AFlutter with 1:1 AV conduction — the initial rate of flutter waves was also 240/minute. Following IV Amiodarone — AV conduction decreased to 2:1 — and — the atrial rate of flutter waves was seen to decrease to ~230/minute (ie, 2:1 AV conduction, with a ventricular rate of ~115/minute).

    ==============================

    Acknowledgment: My appreciation to 陳俊宏 (Chun-Hung Chen from Taichung City, Taiwan) for the case and this tracing.

    ==================================


    =======================

    Related ECG Blog Posts to Today’s Case: 

    • ECG Blog #185 — Reviews my System for Rhythm Interpretation, using the Ps, Qs & 3R Approach.
    • ECG Blog #210 — Reviews the Every-Other-Beat (or Every-Third-Beat) Method for estimation of fast heart rates — and discusses another case of a regular WCT rhythm.
    • ECG Blog #278 — Reviews one more example of how to quickly estimate a very rapid rate for this WCT rhythm.

    • ECG Blog #196 — Reviews another Case with a Regular WCT Rhythm. 

    • ECG Blog #197 — Reviews the concept of Idiopathic VT, of which Fascicular VT is one of the 2 most common types. 

    • ECG Blog #204 — Reviews the ECG diagnosis of the Bundle Branch Blocks (RBBB/LBBB/IVCD). 
    • ECG Blog #203 — Reviews ECG diagnosis of Axis and the Hemiblocks. For review of QRS morphology with the Bifascicular Blocks (RBBB/LAHB; RBBB/LPHB) — See the video ECG Media Pearl #21 in this blog post.

    • ECG Blog #220 — Case Study that reviews my LIST #1: Distinction between VT vs SVT with preexisting BBB or aberrant conduction. (Audio Pearl = How to determine IF your Patient is Hemodynamically Stable).

    • ECG Blog #211 — WHY does Aberrant Conduction occur?

    • ECG Blog #217 — Reviews the concept of how AV Dissociation may help in the diagnosis of VT (including the Audio Pearl in this post).