Thursday, March 17, 2022

ECG Blog #291 (84b) - Errors in ECG (Part-2)


============================
This is Part-2 on Common Errors in ECG Interpretation. Today's Audio Pearl (below) focuses on problems I've observed in recognizing acute coronary occlusion (ie, an "OMI") with need for prompt cath despite the absence of enough ST elevation to satisfy millimeter-criteria for a STEMI.
============================

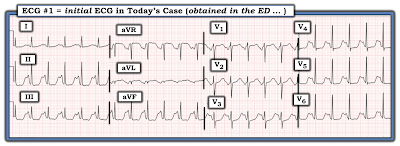
The ECG shown in Figure-1 was obtained from a man with chest pain.  
  • Despite not satisfying millimeter-based criteria for a STEMI — Why should the cath lab be activated?
  • HOW MANY of the 12 leads in this tracing are in support your answer? 

Figure-1: ECG obtained from a man with chest pain (See ECG Blog #272 for the complete case on this patient).  (To improve visualization — I've digitized the original ECG using PMcardio).

=======================================

NOTE: Some readers may prefer at this point to listen to the 6:00 minute ECG Audio PEARL before reading My Thoughts regarding the ECG in Figure-1. Feel free at any time to refer to My Thoughts on this tracing (that appear below ECG MP-84b).

=======================================

Today’s ECG Media PEARL #84b (6:00 minutes Audio) — Reviews my observations in this Part-2 of some Common Errors in ECG Interpretation (special attention to Errors in 12-lead Interpretation) — (Part 1 was in ECG Blog #290). 


ANSWER:
My purpose in reshowing the ECG in Figure-1 (that I initially presented in ECG Blog #272) — is that it highlights a number of often-ignored diagnostic ECG findings of acute coronary occlusion. As emphasized in today's Audio Pearl — Failure to recognize an acute OMI ( = Occlusion-based MI) because millimeter-based STEMI criteria are not yet evident is a potentially lethal error.
  • The rhythm in Figure-1 is sinus at ~70/minute. All intervals and the axis are normal. There is no chamber enlargement. Overall QRS amplitude is reduced.
  • In a patient with new chest pain — T-waves in leads V2-thru-V6 must be interpreted as "hyperacute" until proven otherwise. The 3 leads that are most abnormal in this tracing are leads V3, V4 and V5. In each of these leads — T waves tower over the small-amplitude R waves. Not only are these T waves much taller than the R waves — but these T waves are clearly "fatter"-at-their-peak and wider-at-their-base than one would expect, given the size of the R waves (and QRS complex) in these respective leads.
  • By the concept of "patterns of neighboring leads" — Since the ST-T waves in leads V3, V4 and V5 are so obviously abnormal — the somewhat less obvious ST-T wave changes in neighboring leads V2 and V6 are also almost certainly abnormal.
  • In lead V6 — although the T wave is not taller than the R wave — this T wave in lead V6 is still much taller-than-one-would-expect given small size of the R wave in this lead.
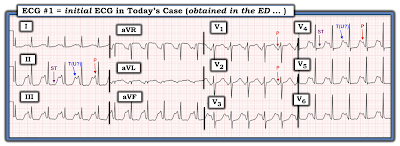
  • Height of the T wave in lead V2 is not as pronounced as T wave amplitude in lead V3. However, the ST segment "takeoff" is unusually straight (ie, parallel to the slanted RED line in lead V2 of Figure-2). In addition, considering how small the r wave is in lead V2 (ie, 2 mm) — the T wave in this lead is once again "hypervoluminous" (ie, clearly with a much wider than-it-should-be base). I would therefore interpret leads V2 and V6 as also being "hyperacute".
  • ST-T wave changes in lead V1 are subtle — but nevertheless "real". Normally in this lead — there is no more than minimal ST elevation. Although the T wave in lead V1 may normally be inverted (PURPLE arrow in Figure-2) — the shape of the ST segment in this lead (ie, coved or "frowny"-configuration, as schematically shown by the curved RED arc) — in association with the ST elevation seen (with respect to the dotted RED line in lead V1 — showing the PR segment baseline) is not a normal finding (especially given obvious ST-T wave abnormalities in the 5 other chest leads)!

Figure-2: I've labeled some of the abnormal ST-T wave changes that were seen in Figure-1.


Regarding ST-T wave Changes in the Limb Leads:

  • The ST-T waves in leads II, III and aVF are all clearly abnormal. ST segments in each of these inferior leads are "scooped", with suggestion of slight ST depression. That said — the most remarkable finding is the terminal T wave positivity in each of these 3 inferior leads (upward-pointing BLUE arrows in Figure-2 — with the most prominent terminally positive T wave being seen in lead II). 
  • Depending on the clinical situation (and the stage of evolution during an acute cardiac event) — this finding of terminal T wave positivity, in association with ST flattening or depression — is clearly abnormal, and may represent the beginning of reperfusion changes (ie, the mirror-image of inverting T waves in leads which manifested ST elevation).
  • Without the benefit of a prior (baseline) ECG for comparison — I was uncertain if the ST-T waves in leads I and aVL were abnormal. I thought the apearance of the QRST complex in lead aVR was unremarkable.


KEY Point: When assessing an ECG for the possibility of acute ischemic heart disease — the more leads that are abnormal, the greater the chance that the abnormalities you identify are real! I find it helpful to start with a few leads that obviously show acutely abnormal ST-T wave findings — and then to apply the concept of "patterns of neighboring leads" as I look closely to identify more subtle findings in the remaining leads.

  • As described above regarding the ECG shown in Figure-2 — We have identified definite ST-T wave abnormalities in no less than 9/12 leads (ie, in leads II,III,aVF — and in all 6 chest leads). This provides strong support in favor of a recent (or still ongoing) cardiac event.


What then is the Error?

The errors that are all too commonly made in patients who present with ECGs similar to the one in today's case include the following:

  • Not appreciating what an "OMI" is — in which the ECG strongly suggests acute coronary occlusion despite not satisfying millimeter-based criteria for a STEMI.
  • Failure to recognize hyperacute ST-T waves in a patient with new symptoms.
  • Failure to appreciate that the more abnormal leads there are in a patient with new symptoms — the more likely it is that an acute cardiac event is ongoing.
  • Failure to appreciate that there are other indications for prompt cath — apart from the finding of a millimeter-specific STEMI on ECG (ie, prompt cath is indicated for ongoing chest pain with abnormal ECG findings that look acute).


Case CONCLUSION:

Cardiac cath was performed on the patient in today's case. Not surprisingly, this revealed total occlusion of the mid-LAD (Left Anterior Descending) coronary artery. Minor lesions were found in the LCx (Left Circumflex) and RCA (Right Coronary Artery).


======================================


ADDENDUM (3/16/2022): 

For clarity in Figure-3 — I have again listed those ECG findings, that when seen in association with new cardiac symptoms — are among those that suggest acute OMI despite not satisfying the millimeter-based definition of a STEMI.


Figure-3: ECG findings to look for when your patient with new-onset cardiac symptoms does not manifest STEMI-criteria ST elevation on ECG. For more on this subject — SEE the September 3, 2020 post in Dr. Smith’s ECG Blog with 20-minute video talk by Dr. Meyers on The OMI Manifesto. For my clarifying Figure illustrating T-QRS-D (2nd bullet) — See My Comment at the bottom of the page in Dr. Smith’s November 14, 2019 post.


Additional Relevant Material to Today's Case:
  • See ECG Blog #185 — for review of the Systematic Ps, Qs, 3R Approach to rhythm interpretation.
  • See ECG Blog #205 — Reviews my Systematic Approach to 12-lead ECG Interpretation.

  • See ECG Blog #193 — for Review of the term, "OMI" ( = Occlusion-based MI).
  • See ECG Blog #218 and ECG Blog #260 — for Review of WHEN a T-wave is Hyperacute.


  • See ECG Blog #204 and ECG Blog #282 — for Review of a user-friendly approach for the ECG Diagnosis of the Bundle Branch Blocks (RBBB/LBBB/IVCD) in a matter of seconds!

  • See ECG Blog #196 and ECG Blog #263 and ECG Blog #220 — for Review on assessing the regular WCT rhythm. 
  • See ECG Blog #197 and ECG Blog #278 — for Review of the Idiopathic VTs (ie, RVOT VT, Fascicular VT, others).

  • See ECG Blog #211 — for Review of why some beats conduct with Aberration.
  • See ECG Blog #42 — for Review of Criteria for distinguishing between VT vs SVT with Aberration or Preexisting BBB.

  • See ECG Blog #240 — for Review on the ECG assessment of the patient with a regular SVT rhythm (including distinction between the various types of SVT reentry).

  • See ECG Blog #214 — for Review of why I emphasize the phrase, "12 Leads are Better than One".

  • See ECG Blog #235 and ECG Blog #286 — for, "Some Simple Steps to Help Interpret Complex Rhythms".

  • For more on distinction between Low Atrial vs Junctional Rhythm — Please see My Comment at the BOTTOM of the page in the January 28, 2019 post in Dr. Smith's ECG Blog.
  • For more on the Emery Phenomenon — Please see My Comment at the BOTTOM of the page in the June 3, 2020 post in Dr. Smith's ECG Blog.


Saturday, March 12, 2022

ECG Blog #290 (84a) - Errors in ECG Interpretation


The ECG shown in Figure-1 was sent to me for my opinion. All I was initially told — was that the chest X-ray and Echo from this middle-aged man were normal — and that correct electrode lead placement was verified.  
  • How would YOU interpret this tracing?

Figure-1: ECG that was sent to me with limited clinical information (See text).


=======================================

NOTE: Some readers may prefer at this point to listen to the 9:00 minute ECG Audio PEARL before reading My Thoughts regarding the ECG in Figure-1. Feel free at any time to refer to My Thoughts on this tracing (that appear below ECG MP-84a).

=======================================

Today’s ECG Media PEARL #84a (9:00 minutes Audio) — Reviews my observations on some Common Errors in ECG Interpretation (Part-1) — with attention to the cardiac rhythm. 


My THOUGHTS on ECG #1:

As always — I approached the ECG shown in Figure-1 systematically — beginning with assessment of Rate and Rhythm (See ECG Blog #205 for my Systematic Approach to 12-Lead ECGs): 

  • QUESTION #1: Did YOU Notice that a simple sinus rhythm is not present in Figure-1 — because the P wave at the beginning of the long lead II rhythm strip is not upright? (YELLOW arrows in Figure-2).

  • QUESTION #2: Did YOU Notice in Figure 2, that the P wave becomes positive after beat #7?

Figure-2: I've labeled P waves in ECG #1. Did YOU Notice that the first 6 P waves in the long lead II rhythm strip are negative?


Today's Audio Pearl reviews a number of Common Errors in ECG Interpretation. One of the most prevalent errors (even among experienced clinicians) — is the failure to begin interpretation by spending the less than 5 seconds it takes to seek out a long lead II rhythm strip — and routinely look in front of each QRS complex to see IF it is preceded by an upright P wave in lead II.
  • IF the P wave in lead II is not upright in front of neighboring QRS complexes — then (assuming there is no dextrocardia or lead misplacement) — the rhythm is not sinus. 
  • Note that although the P wave is negative in each of the inferior leads for the first 6 beats — the P wave is positive in simultaneously-recorded lead aVL for beats #4,5,6. This tells us that atrial activity is traveling backward (retrograde) with respect to the inferior leads — and towards high lateral lead aVL, which defines this as either a Low Atrial or slightly accelerated Junctional Rhythm (See My Comment in the January 28, 2019 post of Dr. Smith's ECG Blog for distinction between these 2 rhythms).

QUESTION #3: What happens in Figure-2 to the P wave in the long lead II rhythm strip after beat #6?
  • Advanced QUESTION #4: Can you explain why this change in P wave morphology after beat #6 occurs? 


ANSWER:
The P wave in front of beat #7 in lead II becomes tiny and isoelectric (RED-YELLOW arrow in Figure-3). After beat #7 — the P wave becomes positive in lead II, and remains so for the rest of the tracing.
  • The change to a positive P wave with a constant and normal PR interval preceding beats #8-thru-13 indicates resumption of sinus rhythm.
  • Verification that the RED-YELLOW arrow in front of beat #7 is in fact pointing to a P wave — is forthcoming from looking in front of beat #7 in the simultaneously-recorded long lead V1 rhythm strip. I suspect that the tiny, isoelectric deflection in front of beat #7 in the long lead II represents an atrial fusion beat at the time of transition from the low atrial (or junctional) rhythm seen for the first 6 beats — to the sinus rhythm that takes over after beat #7.


The reason WHY sinus rhythm resumes after beat #7 is illustrated in Figure-3, in which I have measured (in milliseconds) the R-R interval for each of the beats in this tracing:
  • Although subtle — the rhythm in the long lead rhythm strip is not regular. This is difficult to determine without the use of calipers!

  • PEARL #1: Calipers are not needed for interpretation of many rhythms. The reason calipers are so helpful in today's case — is that they allow you to quickly determine that the reason sinus rhythm resumes after beat #7, is that the sinus rate speeds up enough to overtake the slightly slower low atrial (or junctional) rhythm. A more extended period of monitoring would probably reveal an underlying sinus arrhythmia — with periodic slowing sufficient to allow an ectopic atrial (or slightly accelerated junctional) focus to intermittently take over the rhythm. As opposed to a usurping rhythm — intermittent sinus slowing (with exchange between another pacemaking site) is much more likely to represent a benign phenomenon.


Figure-3: I've labed sinus P waves with RED arrows. Note that the R-R interval decreases for a few beats after beat #7. This allows sinus rhythm to take over (See text).


Let's Complete Our Interpretation of Today's Tracing:
Having assessed the Rate and Rhythm in Figure-3 — Let's complete our systematic interpretation of this 12-lead tracing.
  • Intervals: The PR interval for sinus-conducted beats #8-thru-13 is normal. The QRS is narrow — and the QTc does not appear to be prolonged.
  • Axis: Normal (about +40 degrees).
  • Chamber Enlargement: None.

Regarding Q-R-S-T Changes:
  • Q Waves: None.
  • R Wave Progression: Normal. Transition (where height of the R wave becomes taller than the S wave is deep) occurs normally between leads V2-to-V3. There is an r' (ie, terminal positive deflection) in lead V2 — which probably reflects slight electrode lead misplacement, as an isolated terminal r' in lead V2 but not V1 or V3 does not make anatomic sense. That said — this is unlikely to affect the overall interpretation of todays' tracing.
  • ST-T Wave Changes: There appears to be slight J-point ST elevation in each of the inferior leads. Reciprocal ST depression is not seen in lead aVL — and there are no significant ST-T wave changes in other leads.

PEARL #2: The appearance of ST elevation in the inferior leads of Figure-3 reflects the Emery Phenomenon — in which the oppositely-directed atrial repolarization wave (ie, the T of the P wave) produces a "pseudo"-ST elevation effect because of the relatively large size of the negative inferior lead P waves, with short PR interval for the first 6 beats of the tracing.
  • Most of the time — the Tp (also known as the "Ta" or atrial T wave) is hidden within the QRS complex. But on those uncommon occasions when a large negative P wave with short PR interval is seen in the inferior leads — the resultant oppositely-directed Tp may simulate acute inferior infarction (See My Comment in the June 3, 2020 post in Dr. Steve Smith's ECG Blog for discussion of the Emery Phenomenon in the context of a case that went to cath because of this "pseudo"-ST elevation).

My Clinical Impression of ECG #1:
The underlying rhythm is sinus arrhythmia — with intermittent takeover by a rhythm manifesting negative inferior lead P waves with a short PR interval (either a low atrial or slightly accelerated junctional escape rhythm). There may be slight electrode lead misplacement of lead V2. There is "pseudo"-ST elevation in the inferior leads during periods of the escape rhythm (due to the Emery Phenomenon) — but there are no acute changes.


CASE Follow-Up:
Additional history on today's patient revealed that the reason this ECG was done — was dizziness and a syncopal episode. On further evaluation — the patient was found to be hypovolemic with orthostatic hypotension — and this was thought to be the cause of his syncope. Treatment was with volume replacement. Echo showed excellent systolic function, without any localized wall motion abnormality.
  • My thought on learning this additional history was that this rhythm was probably benign — and given the rate-related dependence of this rhythm shown in Figure-3 — I thought this ectopic rhythm would probably resolve as volume replacement was accomplished.


=======================
Acknowledgment: My appreciation to Hosam Shabib (from Doha, Qatar) for the case and this tracing.
=======================


Additional Relevant Material to Today's Case:
  • See ECG Blog #185 — for review of the Systematic Ps, Qs, 3R Approach to rhythm interpretation.
  • See ECG Blog #205 — Reviews my Systematic Approach to 12-lead ECG Interpretation.

  • See ECG Blog #196 and ECG Blog #263 and ECG Blog #220 — for Review on assessing the regular WCT rhythm. 
  • See ECG Blog #197 and ECG Blog #278 — for Review of the Idiopathic VTs (ie, RVOT VT, Fascicular VT, others).

  • See ECG Blog #211 — for Review of why some beats conduct with Aberration.
  • See ECG Blog #42 — for Review of Criteria for distinguishing between VT vs SVT with Aberration or Preexisting BBB.

  • See ECG Blog #240 — for Review on the ECG assessment of the patient with a regular SVT rhythm (including distinction between the various types of SVT reentry).

  • See ECG Blog #214 — for Review of why I emphasize the phrase, "12 Leads are Better than One".

  • See ECG Blog #235 and ECG Blog #286 — for, "Some Simple Steps to Help Interpret Complex Rhythms".

  • See ECG Blog #193 — for Review of the term, "OMI" ( = Occlusion-based MI).
  • See ECG Blog #218 and ECG Blog #260 — for Review of WHEN a T-wave is Hyperacute.

  • See ECG Blog #204 and ECG Blog #282 — for Review of a user-friendly approach for the ECG Diagnosis of the Bundle Branch Blocks (RBBB/LBBB/IVCD) in a matter of seconds!

  • For more on distinction between Low Atrial vs Junctional Rhythm — Please see My Comment at the BOTTOM of the page in the January 28, 2019 post in Dr. Smith's ECG Blog.
  • For more on the Emery Phenomenon — Please see My Comment at the BOTTOM of the page in the June 3, 2020 post in Dr. Smith's ECG Blog.


Tuesday, March 8, 2022

ECG Blog #289 — Artifact or a Giant Wave?


The ECG in Figure-1 was obtained from a previously healthy woman in her mid-30s — who presented to the ED (Emergency Department) with palpitations. She was hemodynamically stable.


QUESTIONS:

  • How would YOU interpret the ECG in Figure-1?


Figure-1: ECG from a prevously healthy young woman with palpitations.


My THOUGHTS on ECG #1:

As always — I approached the ECG shown in Figure-1 systematically (See ECG Blog #205 for my Systematic Approach to 12-Lead ECGs). My interpretation was as follows: 

  • The QRS complex is narrow — so the rhythm is supraventricular.
  • The rhythm is rapid (ie, ~135-140/minute) and regular.
  • P waves do appear to be present! These P waves look bizarre in lead II (and in the other inferior leads) — because of the highly unusual ST segment and T wave (See below). But the definite negative P wave deflection, with similar PR interval that is clearly seen in leads V1 and V2 confirms that sinus P waves are present! So the rhythm is a very rapid Sinus Tachycardia at ~135-140/minute.

Continuing with my Systematic Approach:
After assessment of Rate and Rhythm — I favor looking at Intervals (PR/QRS/QTc):
  • The PR interval for the tachycardia seen in Figure-1 appears to be normal (ie, It is common for the PR interval to shorten a bit with tachycardia).
  • As already noted — the QRS complex is narrow.
  • However, the 3rd interval ( = the QTc = the QT interval corrected for heart rate) — is markedly prolonged. Assessment of the QTc becomes progressively more difficult as the heart rate becomes faster (especially at rates well over 100/minute). That said, the QT interval for ECG #1 in Figure-1 takes up at least 3/4 of the R-R interval! — so that despite the fast heart rate, the QTc is obviously markedly prolonged.

  • The frontal plane Axis in Figure-1 is normal (about +70 degrees).
  • Chamber Enlargement – None.

==================================

PEARL #1: Even before completing our systematic assessment of the ECG in Figure-1 — I think it worthwhile to introduce the short LIST of Causes of QTc Prolongation that should routinely be considered whenever you encounter a prolonged QTc. This list becomes especially relevant given the dramatic increase in the QTc seen in ECG #1. Assuming there is no bundle branch block, ischemia or infarction (as these entities can prolong the QT) — THINK OF 3 principal Causes:

  • i) DRUGS (many drugs prolong the QT interval — and combinations of drugs may result in marked prolongation).
  • ii) LYTES (ie, Think of low K+ and/or low Mg++ and/or low Ca++) 
  •                      — and/or — 
  • iii) a CNS Catastrophe (ie, stroke, bleed, coma, seizure, trauma, brain tumor). 

  • NOTE: Since the patient in today's case is a previously healthy young woman who is alert enough to complain of "palpitations" — it would seem that a CNS Catastrophe is unlikely. We might also infer that this otherwise healthy young adult woman would probably not be on sufficient medication (ie, "Drugs") to cause marked QTc prolongation. Therefore, even before completing our systematic assessment — recognition of the markedly prolonged QTc should immediately prompt consideration of electrolyte disturbance (ie, "Lytes") as a very possible underlying cause.

==================================


Regarding Q-R-S-T Changes for the ECG in Figure-1:

  • Q waves: There is a tiny Q wave (QS complex) in lead aVL.
  • R wave progression: Normal — with transition (ie, the point where the R wave gets taller than the S wave is deep) occurring normally between leads V3-to-V4.
  • ST-T wave changes: Bizarre! ST segments are surprisingly flat in multiple leads (ie, II,III,aVF; and in V4,V5,V6). As I noted earlier — despite the tachycardia, the QTc is markedly prolonged. 

  • NOTE: For clarity, I have labeled in Figure-2 — selected P waves (in leads II,V1,V2,V4) — and, I've added labels to distinguish between the depressed, flattened ST segments and their neighboring T (and/or U) waves in leads II and V4.

Figure-2: I have labeled the intervals I describe above in the text. NOTE: My landmarks for orientation are the negative P waves in leads V1 and V2 (which I know are sinus P waves!). This P wave landmark confirms for me that the RED arrows I have placed in leads II and V4 are truly pointing to sinus P waves in those leads. I suspect the reason for the huge P wave downslope in lead II is less the "size" of this P wave — and more the fact that the T waves (and/or U waves) are so tall, and the ST segment is placed so low in this bizarre-looking ECG.


CONFESSION: I initially thought the bizarre-looking ST-T waves in Figure-1 were the result of artifact. But as illustrated in Figure-2 — I'm now convinced these deflections are real, and that this ECG simply represents sinus tachycardia with diffuse ST segment flattening and depression + a markedly prolonged QT (or Q-U) interval.
  • LAB RESULTS: The "Clinical Answer" explaining the bizarre appearance of this ECG became evident with return of initial lab results. Serum K+ was markedly decreased = 2.6 mEq/L (Serum Mg++ was similarly decreased).

==================================
What are the ECG Findings of Hypokalemia? 
In my experience — the ECG is not an overly reliable tool for assessing for assessing mild-to-moderate hypokalemia, as both sensitivity and specificity of ECG findings for less-than-severe hypokalemia are relatively low. That said — the changes that one looks for are sequentially illustrated in Figure 3.

Figure-3: Sequential development of ST-T wave changes of hypokalemia. Note increasing U wave amplitude (See text).


To the contents in Figure-3 — I’d add the following points:
  • Not all patients read the textbook. I’ve seen many patients with all of the ECG findings shown in Figure-3 who had normal serum K+. I’ve also seen patients with mild-to-moderate hypokalemia who did not manifest any of the signs in Figure-3. Thus, in my experience — the ECG is less than optimally sensitive or specific as a tool for detecting mild-to-moderate hypokalemia. That said — with more severe degrees of Hypokalemia, the ECG tends to do much better in its prediction, and the ECG is very unlikely to be "normal".

  • PEARL #2 — The finding of U-waves is not specific for hypokalemia! U waves may also be found in patients with LVH and/or bradycardia, and occasionally as a normal variant. That said — when U waves are present, and the clinical history is consistent with (or suggestive of) hypokalemia (as in a patient with vomiting, weakness, a history of alcohol abuse — or in someone taking diuretics) — prompt assessment of serum electrolytes becomes essential!

  • PEARL #3 — IF U waves are so large that they become bigger than (or almost as big as) T waves — then the ECG becomes much more reliable for predicting significant hypokalemia (Panels E and F in Figure-3).

  • PEARL #4 — In my experience — Hypomagnesemia produces virtually identical ECG changes as hypokalemia. This is important — because serum Mg++ levels are not necessarily included in chem profiles unless specifically ordered. Low body magnesium is often encountered in association with other electrolyte abnormalities (ie, low sodium, potassium, calcium or phosphorus); acute MI; cardiac arrest; digoxin/diuretic use; alcohol use and abuse; renal impairment.


==================================
What are the ECG Findings of HypoCalcemia?  
Hypocalcemia generally prolongs the QT interval. It is therefore one of the entities on our short LIST to immediately think of whenever you recognize QT prolongation.
  • PEARL #5: In theory — pure hypocalcemia does not affect the T wave! As a result — the characteristic ECG picture of hypocalcemia is that of a flat and prolonged ST segment, at the end of which occurs a surprisingly normal-looking T wave. 
  • NOTE: This characteristic picture for hypocalcemia may of course change IF the patient also has hyper- or hypokalemia (as in today's case — in which associated hypokalemia might account for those large T/U waves at the end of the prolonged flattened ST segments).
  • Unfortunately, I do not know what the serum Ca++ level was in today's case. However — the fact that the ST segments are so flat in multiple leads in ECG #1 makes me wonder IF in addition to hypokalemia and hypomagnesemia — there may also have been hypocalcemia.


==================================

  • CLICK HERE — for download PDF of Section 11 (from my ECG-2014-ePub) on the ECG Diagnosis of Electrolyte Disorders.

==================================


Today's CASE Continues:

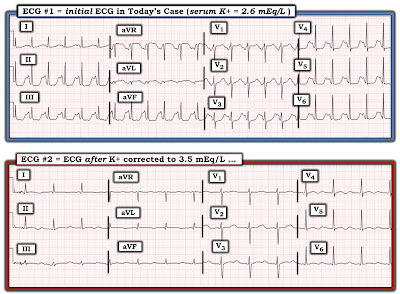
The patient in today's case was treated with electrolyte replacement. Figure-4 shows the follow-up ECG #2 — that was obtained after partial K+ replacement, at which time serum K+ = 3.5 mEq/L (compared to the initial serum K+ value = 2.6 mEq/L, at the time ECG #1 was recorded).


QUESTIONS regarding Figure-4:

  • Are there still ECG findings suggestive of hypokalemia in ECG #2?
  • How does ECG #2 compare with ECG #1?


Figure-4: Comparison of the initial ECG in todays case (when serum K+ = 2.6 mEq/L) — with the follow-up ECG done when serum K+ = 3.5 mEq/L.


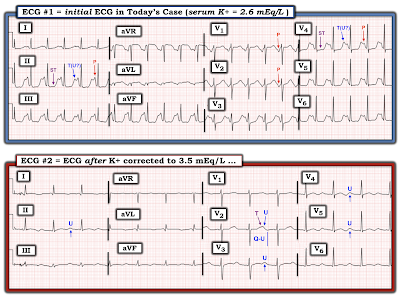
ANSWERS (which I have labeled in Figure-5):
Note that the heart rate has slowed markedly in ECG #2.
  • Did YOU Notice that we do not clearly see an upright P wave in lead II of ECG #2? There does appear to be a small, upright P wave with a short PR interval in leads I and aVL of ECG #2 — and a small, negative P wave with short PR interval in lead III. Thus, the rhythm in ECG #2 is not sinus. Instead — there appears to be a Low Atrial Rhythm.

  • Among the ECG findings of hypokalemia described in Figure-3 that persist in ECG #2 are: i) Nonspecific ST segment flattening in multiple leads; and, ii) Persistent U waves (that are most prominent in the leads that I've labeled in Figure-5). 
  • Note that as serum K+ increases — it becomes easier to define the limits of the U waves that I have labeled.
  • Note also that the Q-U interval remains prolonged — and that U wave amplitude uniformly exceeds the height of those T waves just before them. That said — the ST segment in multiple leads is clearly not as straight and depressed as it was in ECG #1 — and the giant U waves seen in ECG #1 are considerably smaller in ECG #2.

  • PEARL #6: Although serial ECGs will generally show regression of many of the ECG findings of hypokalemia as electrolyte deficiencies are corrected — there is no linear relationship between serum K+ levels and ECG appearance. There may also be a "lag" in time before corrective ECG changes are seen. That said — I viewed it as encouraging that the overall ECG changes of hypokalemia were less marked in ECG #2.

Figure-5: I've labeled the comparison tracings shown in Figure-4.


The "Baseline" ECG:

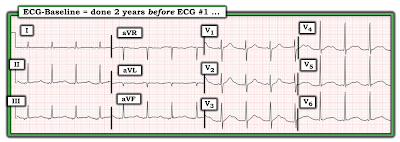
Perusal of the patients medical chart revealed a "baseline" ECG done 2 years prior to ECG #1 (See Figure-6).


QUESTION:

  • Do you think the serum K+ level was normal at the time the "baseline" ECG shown in Figure-6 was obtained?


Figure-6: The "baseline" ECG of today's patient, obtained 2 years before ECG #1.


ANSWER:

One of the problems that I've encountered when "baseline" ECGs are found — is failure to seek out information regarding the patient's clinical condition at the time that the "baseline" tracing was done.

  • IF a patient's "baseline" ECG was obtained at a time when they were acutely ill — then comparison of this previous ECG with the patient's current ECG will not necessarily tell us if ECG changes are new (because the patient could have been having a recurrence of his/her cardiac problem at the time that prior tracing was recorded).
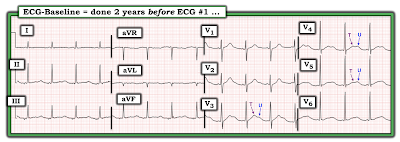
  • I suspect that the previous ECG shown in Figure-6 was not truly a "baseline" tracing — because a number of ECG findings highly suggestive of hypokalemia were present at that time. These include (as shown in Figure-7): i) Non-specific ST-T wave flattening in each of the limb leads; and, ii) Prominent U waves in the leads I have labeled (with U wave amplitude exceeding T wave amplitude in leads V4 and V5).

  • PEARL #7 — I have found it insightful (when possible) to follow patients who have severe electrolyte disorders, with serial ECGs. Doing so allows you to follow the evolution of ST-T wave and U wave changes as serum electrolytes are corrected. As is the case for hyperkalemia — You have NO idea as to what this patient's true "baseline" ECG looks like until you repeat the ECG after you have corrected serum electrolytes.

  • PEARL #8: In my experience — The ECG picture of hypokalemia comes in many forms. Most of the time — these different forms end up being some variation of the U wave.

  • P.S. — Once again, the rhythm in Figure-7 is not sinus, because there is no clearly upright P wave in lead II. Instead — the small amplitude P wave with short PR interval in lead I — together with slight negativity of the P wave in each of the inferior leads once again suggests a low atrial rhythm.


Figure-7: I've labeled the "baseline" ECG shown in Figure-6.


=======================
Acknowledgment: My appreciation to Melvin Lee and Klanseng Ng (from Kluang, Malaysia) for the case and this tracing.
=======================


Additional Relevant Material to Today's Case:
  • See ECG Blog #205 — Reviews my Systematic Approach to 12-lead ECG Interpretation.

  • ECG Blog #152 — for Review through a case on Assessment of the QTc Interval.

  • ECG Blog #27 — for a Review of a case with Hypokalemia.

  • The May 9, 2020 post in Dr. Smith's ECG Blog (Please see My Comment at the bottom of the page) — for Review on the "Many Faces" of Hypokalemia.
  • The March 19, 2019 post in Dr. Smith's ECG Blog (Please see My Comment at the bottom of the page) — for Review of a handy method to rapidly Estimate the QTc and for discussion of a case with a prolonged QTc due to Hypocalcemia.
  • The May 3, 2020 post in Dr. Smith's ECG Blog (Please see My Comment at the bottom of the page) — for Review of a case with a long QTc and profound ST-T wave abnormalities due to Hypokalemia.