Sunday, January 16, 2022

ECG Blog #276 (81) — What About those T Waves?


You are given the ECG shown in Figure-1 — but without the benefit of any history. 


QUESTIONS:

  • How would YOU interpret this tracing?
  • What about those T Waves?


Figure-1: You are given this ECG without the benefit of any history. How would YOU interpret this tracing?


=======================================

NOTE: Some readers may prefer at this point to listen to the 9:50-minute ECG Video PEARL before reading My Thoughts regarding the ECG in Figure-1. Feel free at any time to refer to My Thoughts on this tracing (that appear below ECG MP-81).

=======================================


Today's ECG Media PEARL #81 (9:50 minutes Video) — Summarizes my Systematic Approach to 12-lead ECG interpretation (during the first 2:50 minutes of this video) — after which I apply this Systematic Approach to the tracing shown below in Figure-2. I then work through the list of potential Causes of Giant T-Waves shown below in Figure-3.


Figure-2: Hard copy of the 12-lead ECG that is discussed in detail in the above ECG Video. The patient was a 50-year old man with chest pain. Which cause(s) of those listed in Figure-3 are most likely to account for the Giant T Waves in leads V4-V6?


Figure-3: Reviews KEY content of the above ECG Video — including the definition of Giant T-Wave Syndrome and, the Differential Diagnosis of this ECG finding.


MY Sequential Thoughts on the ECG in Figure-1:

For clarity — I've colored QRST complexes in leads V1, V2 and V3 of today's tracing (Figure-4). As always for interpretation — I favor use of a Systematic Approach (which I review in ECG Blog #205 — as well as during the first 2:50 minutes in today's ECG Video):

  • The rhythm is sinus bradycardia at a rate of ~45-50/minute. The PR, QRS and QTc intervals are all normal (ie, Given the slow heart rate — the QTc is at most no more than minimally prolonged). The frontal plane axis is normal (about +40 degrees).
  • Even though we don't know the age of this patient — QRS amplitudes are increased to such an extent that voltage criteria for LVH are likely to be satisfied regardless of the patient's age (See ECG Blog #245 regarding criteria I favor for ECG diagnosis of LVH).


Regarding Q-R-S-T Changes:

  • Q Waves — None.
  • R Wave Progression — Transition occurs early — as a sizeable R wave is already present in lead V1 — and — by lead V2, R wave amplitude equals S wave depth. There follows predominant R wave positivity beginning with lead V3.


Regarding ST-T Wave Changes:

  • The most remarkable finding on this tracing is the deep, symmetric T wave inversion that is seen in no less than 9/12 leads in Figure-4. The depth of the T-wave inversion in lead V3 attains nearly 15 mm, which is huge!
  • Additional less obvious findings include slight ST elevation (in leads III and V1) — and — 1-to-1.5 mm of J-point ST depression in virtually all leads that manifest T wave inversion.


Figure-4: I've colored QRST complexes in the anterior leads from Figure-1 — so as to highlight the zone of transition in the chest leads (RED, GREEN and BLUE complexes in leads V1, V2 and V3).


Clinical Impression: The ECG in Figure-4 shows fairly marked sinus bradycardia — LVH — and — 1-to-1.5 mm of J-point ST depression, followed by deep, symmetric T wave inversion in multiple leads that could be consistent wth LV "strain" and/or ischemia.

  • Clearly — some History is needed for clinical interpretation of this tracing (ie, Is this ECG from a young, relatively asymptomatic athletic adult? — or — from an older patient with recent or new-onset chest pain?). Without any history — we can merely suggest likely possibilities.
  • That said — the following 2 PEARLS can go a long way toward suggesting the most likely possibilities.


PEARL #1: More than simply "deep, symmetric T wave inversion" in Figure-4 — there are Giant T-Waves. As defined in today's ECG Video (and above in Figure-3) — the designation of "Giant" T waves is reserved for a limited number of clinical entities that are likely to produce truly deep (>5-10 mm amplitude) T wave inversion.

  • The definition of "Giant" T waves is satisfied for the tracing in Figure-4 by the nearly 15 mm of T wave inversion in lead V3. The T wave in lead V4 is at least 8 mm — and the T wave exceeds 5 mm in leads V2 and V5. 
  • Truly "giant" T waves are not overly common. The advantage of identifying this entity — is that doing so should immediately suggest the diagnostic considerations listed in Figure-3.
  • While impossible to determine WHICH of the entities in Figure-3 is (are) most likely — the lack of significant QTc prolongation would seem to make a severe CNS disorder and Takotsubo Cardiomyopathy less likely. The presence of marked voltage for LVH is in favor of Apical Cardiomyopathy. The 1-to-1.5 mm of J-point ST depression in multiple leads is in favor of ischemia.


PEARL #2 — It is tempting on seeing the biphasic T wave with steep downsloping terminal component in lead V2 of Figure-4 (drawn in GREEN) — to think of Wellens’ Syndrome. That said — Wellens’ Syndrome is unlikely to be present in this case. 

  • While acute coronary disease is a diagnostic possibility when there are Giant T waves (ie, acute ischemia is included among the entities listed in Figure-3) — it is well to remember that there are other causes of the ST-T wave picture seen in lead V2 of Figure-4. These include (among others) — LVH, cardiomyopathy, coronary reperfusion. 
  • In Figure-4 — I suspect the reason for the biphasic T wave in lead V2 (drawn in GREEN) — is simply a reflection of the increased QRS and ST-T wave amplitude that we see, with lead V2 representing a “transition lead” placed between the fairly tall positive T wave in lead V1 (drawn in RED) — and the very deep negative T wave in lead V3 (drawn in BLUE).
  • Remember that the diagnosis of Wellens' Syndrome is far less reliable in the presence of LVH — especially in the presence of ST-T wave changes of LV "strain" and/or ischemia (as is seen in Figure-4).
  • With true Wellens' Syndrome — one would not expect such prominent R wave amplitude in the anterior leads as is seen in Figure-4.
  • T wave inversion is generally not this widespread with Wellens' Syndrome — as it is in Figure-4. 
  • NOTE: For more on what Wellens' Syndrome is and is not — See ECG Blog #254 —


==============================

I conclude today's ECG Blog post with a final example of Giant T Waves.

  • What differences do you see between the 2 ECGs in Figure-5?


Figure-5: Compare this final example of Giant T Waves (TOP Panel) — with the initial ECG in today's post ( = Figure-1, shown in the LOWER Panel). Both tracings exhibit Giant T waves. What differences exist between these 2 tracings? (NOTE: I've adapted the ECG in the TOP Panel from the June 22, 2020 post in Dr. Smith's ECG Blog).


ANSWER:

Although both tracings in Figure-5 show Giant T Waves — there are a number of differences between these 2 ECGs.

  • The heart rate is significantly faster in the TOP tracing.
  • QRS amplitude is less in the TOP tracing. That said — voltage for LVH is still satisfied in this TOP tracing by Peguero Criteria (ie, sum of deepest S in any chest lead + S in V4 ≥23 [female] or ≥28 [male]). In this TOP ECG — the S wave in lead V3 (18) + the S in V4 (13) = 31 (See ECG Blog #245 for my review of LVH criteria).
  • The QTc is greatly prolonged in the TOP tracing (it makes up almost 3/4 of the R-R interval) — whereas considering the slow heart rate, the QTc in the LOWER tracing is no more than minimally prolonged.


PEARL #3 — While each of the diagnostic considerations for Giant T Waves that are listed in Figure-3 can potentially lengthen the QT interval — the degree of QTc prolongation seen in the TOP tracing of Figure-5 is more likely to result from Takotsubo Cardiomyopathy or from a severe CNS disorder (ie, CNS bleed, stroke, tumor, trauma, seizure, coma).

  • Wellens' Syndrome seems less likely to cause the ST-T wave appearance seen in the TOP tracing — because the excessively prolonged QTc and diffuseness of T wave inversion are not regular features of Wellens' Syndrome. 
  • As was the case in Figure-4 — I suspect the reason for the ST-T wave appearance in lead V2 of the TOP tracing, is that this lead serves as a "transition lead" between notable T wave positivity in lead V1 — and profound T wave inversion in lead V3.
  • Follow-Up: It turns out that the patient whose ECG is shown in the TOP panel of Figure-5 was having alcohol withdrawal seizures, which I suspect was the principal cause of the Giant T Waves and marked QTc prolongation (ie, severe CNS disorder). Additional details with discussion of this case represented by the TOP tracing in Figure-5 can be found in My Comment at the bottom of the page in the June 22, 2020 post of Dr. Smith's ECG Blog. 


==================================

Related ECG Blog Posts to Today’s Case: 

  • ECG Blog #205 — Reviews my Systematic Approach to 12-lead ECG Interpretation.
  •  
  • ECG Blog #245 — Reviews the ECG diagnosis on LVH (with a 9-minute Audio Pearl in this post on this topic).
  •  
  • ECG Blog #254 — Reviews what Wellens' Syndrome is — and what it is not (with a 7:40 minute Audio Pearl in this post on this topic).
  •  
  • ECG Blog #46 — Reviews ECG findings with Takotsubo Cardiomyopathy.
  •  
  • The June 22, 2020 post in Dr. Smith's ECG Blog — My Comment (at the bottom of the page) reviews the case of Giant T-Waves with prolonged QTc that is shown in the TOP panel of Figure-5 above.


Wednesday, January 12, 2022

ECG Blog #275 — What Chart Audit Suggests?


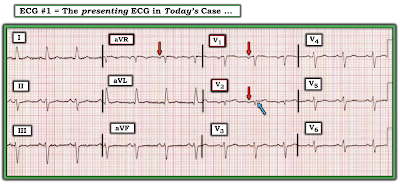
This ECG is taken from chart audit of an older patient seen in the field. Unfortunately — many details of this case are lacking.

  • How would YOU interpret this tracing?
  • What diagnoses do you suspect?


Figure-1: ECG taken from chart audit of an older patient seen in the field (See text).


=======================================

NOTE: Some readers may prefer at this point to listen to the 8:30-minute ECG Audio PEARL before reading My Thoughts regarding the ECG in Figure-1. Feel free at any time to refer to My Thoughts on this tracing (that appear below ECG MP-58).

=======================================


Today's ECG Media PEARL #58 (8:30 minutes Audio) — Reviews some lesser-known Pearls for ECG recognition of Hyperkalemia.


MY Sequential Thoughts on the ECG in Figure-1:

It's always challenging to try to interpret an ECG without benefit of the clinical history. Nevertheless — We are often asked to do so. Herewith follow my sequential thoughts on seeing this tracing, knowing only that this patient was found "in the field".

  • The rhythm is obviously slow (ie, the rate is in the low 40s/minute). Although there is no long lead rhythm strip — the rhythm is surprisingly regular. 
  • Sinus P waves are seen in multiple leads, albeit these P waves are of very low amplitude (RED arrows in Figure-2).
  • The PR interval is constant, albeit prolonged (ie, to at least 0.32 second) — therefore 1st-Degree AV Block.
  • The QRS complex is very wide (ie, vertical BLUE lines in lead aVF suggest that the QRS complex is prolonged to ~0.20 second).
  • QRS morphology is extremely unusual. It resembles LBBB in the limb leads (albeit with initial Q waves in leads I and aVL). In the chest leads — QRS morphology resembles RBBB (qR pattern in lead V1; wide terminal S wave in lead V6).
  • There is marked left axis deviation (about -60 degrees) in the frontal plane.
  • In addition to the Q waves in limb leads I and aVL — Q waves are also present in leads V1 and V2, with a tiny initial q wave in lead V3.
  • There are marked ST-T wave abnormalities. These include ST elevation with T wave inversion in limb leads I and aVL — ST coving with T wave inversion in leads V2, V3 — and — an unusual coved-shape of ST elevation in lateral chest leads V4,V5,V6.


My Clinical Impression: The ECG findings in Figure-2 suggest 2 Diagnoses to me: i) Hyperkalemia until proven otherwise; and, ii) An associated acute evolving STEMI.

  • Although the tall, peaked T waves with narrow base that are characteristic of hyperkalemia are not seen in today's ECG — other findings strongly suggest Hyperkalemia until proven otherwise. These include: a) Marked bradycardia; b) 1st-degree AV Block with a very prolonged PR interval; c) The tiny size of P waves; and, d) The marked QRS widening (ie, to 0.20 second) — with an unusual QRS morphology not resembling any known conduction disturbance.
  • QRST Changes in 3 different lead areas suggest recent (if not actively ongoing) Infarction. High lateral leads I and aVL each show Q waves, ST elevation and T wave inversion (with subtle suggestion of reciprocal ST segment and T wave changes to lead aVL in lead III). Anterior leads V1,V2,V3 all show initial Q waves — with ST coving and T wave inversion in lead V2 — and ST coving with terminal T wave positivity in lead V3. Finally — each of the lateral chest leads (V4,5,6) show ≥2 mm of coved ST elevation.


Figure-2: I've labeled KEY findings from Figure-1 . The horizontal dotted RED lines in leads I, aVL; V4,V5,V6 show there is definite ST elevation with respect to the PR segment baseline (See text). 


CASE Follow-Up:

Chart audit revealed that this patient was unresponsive when found in the field. She died soon after emergency services (EMS) arrived. Because of her rapid demise — lab tests were not drawn. The terminal rhythm was PEA — with an extremely slow rhythm and a markedly widened QRS.

  • I don't know if IV Calcium was given.

======================================


Important Points about HyperKalemia:

Rapid recognition of Hyperkalemia is among the most important of skills for emergency providers to master. The reasons for this are simple: 

  • i) Hyperkalemia is potentially life-threatening.
  • ii) There is an empiric treatment (ie, IV Calcium) that can be life-saving — and which should often be given prior to lab confirmation of hyperkalemia, because cautious administration is safe — and not-to-promptly treat the patient risks losing the patient.
  • iii) Not-to-recognize hyperkalemia as the cause of QRS widening, unusual rhythm disturbances and/or ST-T wave abnormalities will lead you down the path of potentially serious misdiagnosis.


PEARL #1: Be aware that IF you suspect potentially life-threatening hyperkalemia — that IV Calcium should be immediately given without the need to wait for lab confirmation.

  • IV Calcium works fast (ie, within 2-3 minutes) by an action that stabilizes myocardial membrane potential, thereby reducing cardiac membrane excitability provoked by hyperkalemia (thereby protecting against cardiac arrhythmias). IV Calcium does not cause intracellular potassium shift, and it does not facilitate elimination of this cation.
  • Either Calcium Chloride or Calcium Gluconate can be used (10 mL given IV over 3-5 minutes with ECG monitoring). NOTE: The chloride form contains 3X the amount of calcium per 10 mL dose (10 ml 10% CaCl = 6.8 mmol Ca++ vs 10 ml 10% CaGlu = 2.3 mmol Ca++). 
  • IV Calcium should be repeated IF there is no effect (ie, narrowing of the QRS on ECG) after 5-10 minutes. More of the gluconate form may need to be given (since it contains less calcium). The duration of IV Calcium is only ~30-60 minutes — but this should allow sufficient time for other treatments to be given.
  • CaGlu can be given through a peripheral IV line. Because CaCl is more likely to cause tissue necrosis if there is extravasation — a central line is recommended (except if your patient is in cardiac arrest). 
  • Other treatments will often be needed (ie, Glucose/Insulin; Albuterol inhalation; Sodium Bicarbonate — and in refractory cases, hemodialysis) — but IV Calcium is the treatment of immediate choice for potentially life-threatening hyperkalemia.
  • IV Calcium is not indicated for the treatment of peaked T waves with a narrow QRS and reasonable rhythm — as this is not a life-threatening situation.


The Textbook Sequence of ECG Changes:

For clarity — I've added Figure-3, which presents the "textbook" sequence of ECG findings seen with progressive degrees of hyperkalemia. While fully acknowledging that "not all patients read the textbook" — and that there will be variations in the various ECG findings from one patient-to-the-next — I have found awareness of the generalizations for these ECG signs in Figure-3 to be extremely helpful.

  • The most common earliest sign of Hyperkalemia is T wave peaking. This may begin with no more than minimal K+ elevation (ie, K+ between 5.5-6.0 mEq/L) — although in some patients, T wave peaking won't be seen until much later (and in some patients — T wave peaking is never seen).
  • PEARL #2: I love the image of the Eiffel Tower. With progressive degrees of hyperkalemia — the T wave (like the Eiffel Tower) becomes tall, peaked (pointed) with a narrow base. While patients with repolarization variants or acute ischemia (including the deWinter T wave pattern) often manifest peaked T waves — the T waves with ischemia or repolarization variants tend not to be as pointed as is seen with hyperkalemia — and, the base of those T waves tends not to be as narrow as occurs with hyperkalemia.
  • PEARL #3: As helpful as I find Figure-3 is for providing insight to the ECG changes we look for when suspecting clinically significant hyperkalemia — progression from sinus rhythm to VFib as the 1st ECG sign of hyperkalemia has been documented. Not all patients read the textbook. (emDocs, 2017 — Management of Hyperkalemia).


Figure-3: The "textbook" sequence of ECG findings with hyperkalemia.


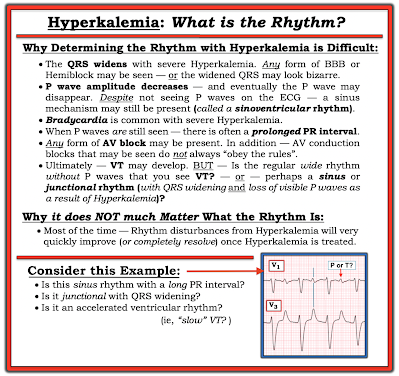
PEARL #4: Assessment of the rhythm with severe hyperkalemia is often extremely difficult because: i) As serum K+ goes up — P wave amplitude decreases, and eventually P waves disappear (See Panels D and E in Figure-3); ii) As serum K+ goes up — the QRS widens; and, iii) In addition to bradycardia — any form of AV block may develop (ie, AV conduction disturbances with severe hyperkalemia often do not "obey the rules" — See Figure-4).

  • THINK for a MOMENT what the ECG will look like IF you can't clearly see P waves (or can't see P waves at all) — and the QRS is wide? ANSWER: The ECG will look like there is a ventricular escape rhythm, or like the rhythm is VT if the heart rate is faster.
  • NOTE: P waves are extremely small in Figure-2. It is likely that with further increase in the serum K+ level — that P waves would no longer be seen. This would leave us with a slow rhythm without P waves, and with a very wide QRS complex — which would then be indistinguishable from a slow IVR (IdioVentricular Rhythm).


PEARL #5: As we have just noted, with progressive hyperkalemia — P wave amplitude decreases until ultimately P waves disappear. Interestingly, the sinus node is often still able to transmit the electrical impulse to the ventricles in such cases, even though no P wave may be seen on ECG. This is known as a sinoventricular rhythm.


PEARL #6: In my opinion, it is not worth wasting time trying to figure out the specific rhythm diagnosis of a bradycardia when there is hyperkalemia. I used to spend hours trying to do this — but after years of doing so, I finally realized: i) That a specific rhythm diagnosis is rarely possible when there is significant hyperkalemia — and, even if you succeed in making a diagnosis such as Wenckebach — chances are as serum K+ intra/extracellular fluxes change, that the cardiac rhythm will also soon change; and, ii) Clinically — it does not matter what the specific rhythm diagnosis is once you recognize hyperkalemia that needs to be immediately treated — because usually within minutes after giving IV calcium, the "bad" rhythm will probably "go away" (often with surprisingly rapid reestablishment of sinus rhythm).


Figure-4: Why assessing the rhythm with hyperkalemia is difficult (See text).


PEARL #7: With marked hyperkalemia — it is impossible to know how much the elevated serum K+ is influencing QRS width and ST-T wave morphology until you normalize serum K+ and then REPEAT the ECG!

  • For example — IF there was significant ST depression on the baseline tracing — then the "net effect" of such ST depression might sufficiently attentuate the T wave peaking of hyperkalemia in a way that produces "pseudo-normalization" of ST segments and T waves.
  • Hyperkalemia may mask the ST-T wave changes of acute infarction. Alternatively — hyperkalemia may produce a "pseudo-STEMI" pattern that simulates acute infarction.
  • With severe hyperkalemia — You can get an idea of the extent that excess serum K+ is altering the ECG by the improvement seen within minutes of giving IV Calcium. However, because the duration of action of IV Calcium is limited (ie, to ~30-60 minutes) — improvement of hyperkalemia-induced ECG changes following a dose of IV Calcium will be transient (until other measures produce a longer-lasting effect).


==================================


Final THOUGHTS regarding Today's CASE:

I was asked to interpret the ECG in Figure-1 in the "retrospectoscope" (ie, from the comfort of my desk armchair, sipping a cool drink as I viewed the tracing on my large screen desktop computer). This is admittedly a very different situation than being on-the-scene with an acutely ill patient under suboptimal conditions.


That said — the reason I immediately suspected severe hyperkalemia (despite the lack of T wave peaking)— was the combination of these 4 ECG findings:

  • Marked bradycardia
  • 1st-degree AV block with marked PR interval prolongation.
  • The tiny size of P waves.
  • Marked QRS widening (up to 0.20 second) — with an unusual QRS morphology not resembling any known form of conduction defect. 

In addition — acute infarction was suggested by:

  • Q waves, ST elevation and T wave inversion in leads I and aVL.
  • Q waves in V1,V2 (tiny q in V3) — with ST-T wave changes in these leads that potentially were recent — plus — definite coved ST elevation in lateral chest leads.


My THOUGHTS in the Retrospectoscope:

  • Given that this patient was unresponsive when found on the scene — one or more doses of IV Calcium was indicated (even before any labs might be drawn to confirm suspected hyperkalemia). There is little to lose by such treatment in this critical patient — and it might work if there was severe hyperkalemia.
  • IF there was significant hyperkalemia — then improvement in the above ECG findings would be expected within minutes after giving IV Calcium — at which point decisions could be made on the likelihood of acute infarction.
  • I have no idea if the above treatment might have helped in this case ...


==================================

Acknowledgment: My appreciation to David Didlake (USA) for allowing me to use this case and these tracings.

==================================


Related ECG Blog Posts to Today’s Case: 

  • ECG Blog #205 — Reviews my Systematic Approach to 12-lead ECG Interpretation.
  • ECG Blog #185 — Reviews my Systematic Approach to Rhythm Interpretation (Assessment using the Ps,Qs & 3R Approach).

  • ECG Blog #244 — Reviews a case of Hyperkalemia + Brugada Phenocopy.
  •  
  • The January 26, 2020 post in Dr. Smith's ECG Blog — Reviews a number of examples of hyperkalemia (with My Comment at the bottom of the page).
  • The September 5, 2020 post in Dr. Smith's ECG Blog — Reviews another case of Brugada Phenocopy from Hyperkalemia (with My Comment at the bottom of the page). 
  • The October 21, 2020 post in Dr. Smith's ECG Blog — Reviews a case of Hyperkalemia which highlights the difficulty of determining the Rhythm (with My Comment at the bottom of the page).

  • NOTE: There are links to numerous cases of life-threatening Hyperkalemia with "other" ECG findings (beyond tall peaked T waves) — in the excellent January 16, 2022 post by Drs. Meyers & Smith, in Dr. Smith's ECG Blog. Please also check out MY COMMENT at the very bottom of this page!


Saturday, January 8, 2022

ECG Blog #274 — New or Old Septal Infarction?


The ECG in Figure-1 was obtained from an older woman with known coronary disease — who presented with shortness of breath and some chest discomfort.


QUESTIONS:

  • How would YOU interpret the ECG in Figure-1?
  • Is there evidence of new or old septal infarction?
  • WHY do you think I am presenting this case?


Figure-1: ECG from an older woman with known coronary disease — with shortness of breath and some chest discomfort.


=======================================

NOTE: Some readers may prefer at this point to watch to the 11:00-minute ECG Video PEARL before reading My Thoughts regarding the ECG in Figure-1. Feel free at any time to refer to My Thoughts on these tracings (that appear below ECG MP-77).

=======================================


ECG Media Pearl #77 (11:00 minutes Video) — Reviews assessment of R-Wave Progression as part of the Q-R-S-T memory aid in the Systematic Approach to 12-lead interpretation (includes clarification of PRWP vs delayed Transition).

  • Common causes of PRWP (Poor R Wave Progression) are shown below in Figure-2. The fact that conditions as opposite as LVH and RVH may cause "PRWP" — calls into question the clinical utility of this designation. For this reason — I favor simply describing what is seen regarding chest lead QRS appearance, including the zone of Transition (the leads between which the R wave becomes taller than the S wave is deep).
  • For more on assessment of R-Wave Progression — Please see ECG Blog #269.


Figure-2: Common causes of PRWP (See the Video Pearl in today's case!).


My THOUGHTS on ECG #1:

As always — I approached the ECG shown in Figure-1 systematically (See ECG Blog #205 for my Systematic Approach). My interpretation was as follows: 

  • Sinus rhythm @80/minute.
  • Normal PR and QTc intervals. The QRS appeared to be slightly wide (ie, ~0.11 second) — though not in a bundle branch block pattern.
  • There is marked left axis deviation — consistent with LAHB (Left Anterior HemiBlock). As reviewed in ECG Blog #203 — diagnosis of LAHB can usually be made within seconds by appreciation of a predominantly negative QRS complex in lead II, in association with a positive QRS in lead I. NOTE: LAHB may prolong the QRS by 0.01-0.02 second — so this could account for the slight QRS widening.
  • No chamber enlargement.


Regarding Q-R-S-T Changes:

  • Q waves: Small and narrow q waves are seen in lateral leads I and aVL. Their appearance is consistent with normal septal Q waves. Potentially not so benign are the Q waves seen in leads V1 and V2.
  • R wave progression: Transition (ie, the point where the R wave gets taller than the S wave is deep) is either delayed or never occurs in ECG #1 (ie, it's difficult to determine if the R wave in lead V6 is or is not greater than the S wave in this lead). This qualifies as PRWP (Poor R Wave Progression).
  • ST-T wave changes: There is nonspecific ST-T wave flattening in multiple leads, that overall does not look acute. That said — What about the positive T wave in lead V2 that potentially is disproportionately tall considering how tiny the QRS complex is in this lead? 


So WHY is there PRWP?

As discussed in today's Video Pearl (and as shown above in Figure-2) — there are a variety of potential causes of PRWP. The most relevant potential causes to consider in today's case include:

  • LAHB.
  • Pulmonary disease.
  • Lead misplacement.
  • Anterior or anteroseptal infarction.


Why might LAHB (Left Anterior HemiBlock) cause PRWP? 

  • The bundle of conduction fibers in the LAH (Left Anterior Hemifascicle) lies slightly in front of (anterior to) fibers in the LPH (Left Posterior Hemifascicle). As a result — block in the LAH (as occurs with LAHB) results in an initial posterior direction for electrical activity, that is first conducted over the intact LPH. This often leads to reduction in r wave amplitude in the anterior leads — which may sometimes simulate anterior infarction.


What about COPD (Chronic Obstructive Pulmonary Disease)?

  • Severe longstanding pulmonary disease leads to an increase in right ventricular forces. In addition — orientation of the heart’s electrical forces in 3 dimensions may be altered by the large emphysematous chest of a patient with chronic COPD. These physiologic changes may result in ECG signs of: i) Poor R wave progression; ii) Persistence of relatively deep precordial S waves in lateral chest leads; and, iii) Reduced R wave amplitude across the chest leads. In the extreme — R waves are markedly reduced in size (and may even be absent) in anterior precordial leads (See ECG Blog #234 for review on the ECG diagnosis of pulmonary disease and RVH).


WHY am I Presenting this CASE?

The principal reason I chose to present this case — is to highlight lead misplacement as the most likely cause for the Q waves in leads V1 and V2 of Figure-1.

  • Chest lead misplacement of leads V1 and V2 is surprisingly common. In an informal study I participated in, in which a series of internet-published examples supposedly illustrating "proper lead placement" were reviewed — more than half of these published examples showed faulty lead placement. That is — instead of proper placement of the lead V1 and V2 electrodes, just to the right and to the left in the 4th ICS (InterCostal Space), as shown in Figure-3 — electrode placement of these 2 leads was in the 3rd, or even as highly placed as the 2nd ICS! Given this frequency of errors among published "teaching examples" — One can only wonder how widespread faulty placement of leads V1 and V3 must really be in clinical practice!
  • In my experience over the past decade in reviewing and commenting on acute ECGs posted on numerous international ECG internet forums — emergency care providers commonly fail to recognize this form of lead misplacement. 


Figure-3: Anatomic landmarks for placement of the 6 precordial leads (from Grauer K: ECG-2014-ePub). Note that leads V1 and V2 should be placed in the 4th ICS (InterCostal Space), just to the right and to the left of the sternum. All too often — these leads are placed too high on the chest (in the 2nd or 3rd ICS).


===========================

3 Clues to Quickly Recognize V1, V2 Misplacement:

Despite the alarming frequency of lead placement errors — the "good news" is that it is EASY to suspect when misplacement of leads V1/V2 is likely! There are 3 clues to look for:


Suspect leads V1 and/or V2 have been placed 1 or 2 interspaces too high on the chest IF one or more of the following clues are present:

  • Clue #1 — If there is an r’ in leads V1 and/or V2, especially if the other finding for incomplete RBBB (ie, terminal s waves in lateral leads I and V6) is absent.
  • Clue #2 — If there is a significant negative component to the P wave in lead V1 and/or V2.
  • Clue #3 — If the appearance of the P wave, QRS complex and ST-T wave in leads V1 and V2 looks very much like the P wave, QRS complex and ST-T wave in lead aVR.


NOTE: As helpful as the above 3 Clues are for quickly suspecting too high placement of leads V1 and/or V2 — these clues are not infallible. There are times when despite our suspicion from looking at an ECG that leads V1 and V2 have been placed too high — this will turn out not to be the case. For example: i) Incomplete RBBB may truly be present (resulting in a terminal r' in leads V1 and/or V2); ii) An all negative, relatively large P wave may sometimes be seen in leads V1,V2 as a normal finding — or — the patient may have true left atrial enlargement; iii) Variation in body habitus and chest wall anatomy may produce unusual ECG findings; and/or, iv) The patient may truly have had prior septal infarction.

  • Therefore, my goal in presenting these 3 clues — is that they suggest when to suspect that an unusual anterior lead appearance might best by explained by too-high positioning of lead V1 and/or V2.
  • It's EASY to check out your suspicion. Simply verify that chest lead placement is correct — and then REPEAT the ECG!


===========================


TRY OUT these 3 Clues:

ECG "B" in Figure-4 was obtained just a short while after ECG "A".

  • WHY did the treating clinician suspect too-high placement of leads V1 and V2 in ECG "A"?
  • What changes do you see in the repeat ECG ( = ECG "B") after correcting for erroneous placement of leads V1 and V2?


Figure-4: Comparison of "before" and "after" tracings — to illustrate ECG findings of too-high placement of the lead V1 and V2 electrodes. (NOTE: I've adapted the 2 ECGs in this Figure from the November 4, 2018 post in Dr. Smith's ECG Blog). 


ANSWERS:

The clinical concern on seeing ECG "A" in Figure-4 — was whether the Q waves in leads V1 and V2 indicated prior septal infarction? The reason too-high placement of the V1 and V2 electrodes was suspected — is that all 3 Clues described above are seen:

  • There is a significant negative component to the P waves in leads V1 and V2 (these P waves are all negative in ECG "A").
  • There is a small-but-definite terminal r' after the large Q waves in both leads V1 and V2.
  • The P wave, QRS and T wave appearance in lead V1 closely resembles the appearance of these deflections in lead aVR.
  • In addition — there is a rather abrupt transition from the tiny QRS complexes in leads V1,V2 — to the significantly larger QRST complex with positive P wave in lead V3.


After correcting for erroneous V1,V2 lead placement — ECG "B" now shows:

  • Restoration of positive P waves in both V1 and V2 (with the positive P wave in lead V2 now closely resembling P wave morphology in neighboring lead V3).
  • Disappearance of the small-but-present terminal r' in leads V1 and V2.
  • A completely different P-QRS-T wave appearance for leads V1 and V2 — compared to lead aVR (See Figure-5 for a magnified view of the changes in leads V1,V2 after correction of erroneous lead placement).
  • NOTE: I suspect that the position of lead V3 in ECG "A" of Figure-4 may have also been incorrect — since after checking lead placement position and repeating the ECG — there is now (in ECG "B") a predominantly positive QRS complex in lead V3.


Figure-5: Magnified view of leads aVR, V1 and V2 from Figure-4 — to emphasize ECG findings before and after correcting for too-high placement of leads V1 and V2. Note disappearance of the terminal r' (BLUE arrows in ECG "A") — positivity of the P waves in leads V1,V2 in ECG "B" — and loss of resemblance between the P-QRS-T wave appearance of leads V1,V2 with lead aVR.


Today's CASE Conclusion:

Let's return to the initial ECG in today's case (Figure-6). I previously listed the 4 conditions most likely to account for the PRWP in ECG #1. These were:

  • LAHB.
  • Pulmonary disease.
  • Lead misplacement.
  • Anterior or anteroseptal infarction.


Armed with the 3 Clues for suspecting leads V1,V2 misplacement — Let's now revisit these 4 entities:

  • LAHB is present in ECG #1 (See Figure-6). Therefore — this conduction defect may indeed be contributing to the PRWP and lack of initial r wave in leads V1 and V2. The slight QRS widening and presence of LAHB in this tracing could both be the result of this patient's known coronary disease.
  • Although we are only provided with limited information about the medical history of today's patient — we are told that this older woman presented with shortness of breath. Poor R wave progression — marked frontal plane axis deviation — and persistence of sizeable S waves through to lead V6 can all be seen with chronic pulmonary disease. That said — other ECG findings of pulmonary disease are not seen in ECG #1 (ie, no right axis; no right atrial enlargement, no right-sided ST-T wave "strain", and no predominant R wave in lead V1). Therefore — I did not suspect chronic pulmonary disease as a significant contributing factor to this patient's PRWP.
  • Although the 3 clues to too-high placement of the V1,V2 electrode leads are not all present in ECG #1 — I still suspected that placement of leads V1,V2 was not optimal because: i) The appearance of leads aVR, V1 and V2 all look similar in ECG #1 (ie, predominantly negative, small-amplitude QRS complexes that are each preceded by a relatively sizeable negative P wave [RED arrows in Figure-6]); ii) There is a small-but-definite terminal r' in lead V2 (BLUE arrow) — and it's unusual to see this only in lead V2 but not V1 when lead placement is normal; and, iii) There is an abrupt transition from the tiny QRS complex in lead V2 — to the significantly larger QRST complex with positive R wave in lead V3 (which is now preceded by a positive P wave in lead V3).
  • To Emphasize — I can not rule out the possibility of septal infarction of uncertain age in ECG #1. After all — we are told that this older woman has known coronary disease — and that she is now presenting for care because of "chest discomfort". IF electrode lead placement in ECG #1 is accurate — then it would be possible that the Q waves in leads V1,V2 could represent septal infarction — and — that the disproportionately tall T wave in lead V2 could represent an acute change in this patient with new chest discomfort (This T wave is "tall" considering tiny amplitude of the QRS in lead V2).


BOTTOM Line: I suspect that ECG #1 most likely does not represent recent or acute septal infarction. That said — the onus of proof is on us to rule out an acute event, rather than the other way around. Clinically — I would favor the following:

  • Verify lead placement — and repeat the ECG. This will immediately tell you IF the reason for the QS in lead V1 and the Qr with surprisingly prominent T wave in lead V2 are "real" — or the result of faulty lead placement. Repeating the ECG will also tell you if there is ongoing evolution of these ECG findings.
  • Try to find a prior ECG on this patient (as another way to find out if the ECG findings in leads V1,V2 are recent or acute).
  • Get more history (to determine IF a recent or acute event seems likely).
  • IF doubt remains — further evaluation (ie, serial troponins, serial ECGs, stat Echo during symptoms looking for localized wall motion abnormality) may all be needed to rule in or out an acute cardiac event. 


Figure-6: I've labeled Figure-1 to highlight ECG findings that suggest possible too-high placement of the V1,V2 electrode leads.


Final PEARL: Although one should clearly consider the possibility of previous “septal infarction” in the presence of deep Q waves (or QS complexes) in leads V1 and V2 — in the absence of another Q wave (or QS complex) in lead V3 — the vast majority of patients with Q waves in V1 and V2 but not V3, will not have prior “septal” infarction. 

  • Clinical correlation, comparison with prior tracings, and verification of correct lead placement would all be needed for optimally accurate comment on the likelihood of prior septal infarction in such cases.


==================================

Acknowledgment: My appreciation Sarah Johnson Saunders (from North Carolina, USA) for making me aware of this case and allowing me to use this tracing.

==================================


Related ECG Blog Posts to Today’s Case: 

  • ECG Blog #205 — Reviews my Systematic Approach to 12-lead ECG Interpretation (outlined in Figures-2 and -3, and the subject of Audio Pearl MP-23-LINK in Blog #205).
  •  
  • ECG Blog #269 — Reviews assessment of R-Wave Progression (including the causes of "Poor" R wave progression).
  •  
  • ECG Blog #203 — Reviews the basics for assessing Axis + a user-friendly approach for the ECG diagnosis of the Hemiblocks (with text and Video Pearls on these 2 subjects).
  •  
  • ECG Blog #234 — Reviews the ECG diagnosis of RVH and Pulmonary Disease.
  •  
  • ECG Blog #218 — Reviews when a T-Wave is Hyperacute.
  •  
  • The November 4, 2018 post in Dr. Smith's ECG Blog — from which the tracings in Figure-2 and Figure-3 of today's case are taken.