Friday, June 22, 2012

ECG Blog #46 — STEMI or a Broken Heart?


The ECG shown was obtained from a 74-year-old woman who presented with abrupt onset of severe renal colic but no chest pain. Based on findings seen in her ECG — acute cardiac catheterization was performed. Her coronary arteries were normal on cath. Troponins were only minimally elevated. 
  • How would you interpret her ECG? 
  • How might you explain the finding of normal coronary arteries on cardiac catheterization?

Figure 1: ECG obtained from a 74-year old woman with renal colic, but no chest pain.


INTERPRETATION: The ECG shows sinus rhythm at a rate close to 100/minute. The PR and QRS intervals appear to be normal — but the QT is prolonged. The axis is normal (approximately +70 degrees). There is no chamber enlargement. An rSr’ complex is noted in lead V1. 
  • Assessment of Q-R-S-T Changes is remarkable for the presence of inferior Q waves — normal transition (R wave becoming taller than the S wave between leads V3-to-V4) — and ST segment coving with marked elevation in the inferior leads. This is accompanied by deep T wave inversion. 
  • Similar abnormal ST segment coving and elevation (albeit not as marked) is also present in leads V4,V5. Deep, symmetric T wave inversion that begins in lead V3 is seen in V4,V5. 

Despite the absence of chest pain — the impression from interpretation of this ECG was “probable acute STEMI" (ST-Elevation Myocardial Infarction) with need for immediate cardiac catheterization and probable reperfusion”. Surprisingly, cardiac catheterization revealed normal coronary arteries. Instead — the ventriculogram revealed apical ballooning with hypercontractility of the cardiac base characteristic of Takotsubo Cardiomyopathy. The patient was treated supportively with recovery of left ventricular function over the next few weeks. 
  • Takotsubo Cardiomyopathy is an underappreciated cause of acute ECG abnormalities and new-onset heart failure. The entity was first described in Japan in 1990, with the name takotsubo being derived from a specially designed container used by Japanese fishermen to trap octopuses. The unusual round bottom and narrow neck design of takotsubo resembles the diagnostic picture on cardiac catheterization obtained as a result of ballooning of the cardiac apex with hypercontraction of the base (Figure-2).
  • Other names attributed to this entity include “stress cardiomyopathy” and “broken-heart syndrome” — in reference to the common occurrence of severe physical or emotional stress prior to onset of the disorder. Awareness of this syndrome is important — because the initial ECG may mimic a large apical infarction (with inferior and anterior ST segment elevation). Transient heart failure is common during the initial stages, but fortunately resolves within a few weeks in most cases.
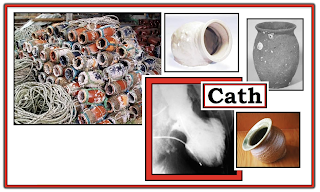
Figure-2: Collection of actual takotsubo showing the round bottom and narrow neck — that resembles the diagnostic picture seen on the cardiac catheterization ventriculogram (shown here during end-systole). Note characteristic "ballooning of the apex and hypercontractility of the base during cardiac cath (See text).

The Mechanism of Takotsubo CMP (CardioMyoPathy):

The precise mechanism for Takotsubo CMP remains elusive. While factors such as coronary spasm; disturbance of the microcirculation; coronary artery anatomic variation; and neurogenic myocardial stunning have all been implicated — their role is uncertain. What has been shown — is that abnormal response to an increase in endogenous catecholamines is almost always involved. Blood epinephrine and norepinephrine levels are unmistakably elevated (sometimes dramatically) in patients with Takotsubo CMP.

  • In addition — there is more-than-coincidental preceding occurrence of intense situational or psychological stress in many patients. This may be in the form of severe emotional stress (death of a loved one; break-up from significant other; overwhelming anxiety/depression) — pain — and/or fear (from earthquake or other catastrohic event). It is easy to understand the rationale for other names that have been used for this syndrome (ie, "Stress" Cardiomyopathy or "Broken-Heart" Syndrome).
  • Although consensus is still lacking regarding specific criteria for defining Takotsubo CMP — there is general agreement that cardiac cath is diagnostic (ie, apical ballooning but no "culprit" artery).


SUMMARY of the Clinical Picture:

Takotsubo CMP is most typically seen in an older patient (most often in a post-menopausal woman) — who presents with chest pain or new heart failure. Look for the following features:

  • Likelihood of preceding severe physical/emotional stress.
  • Markedly abnormal initial ECG — often with diffuse ST elevation in inferior and antero-lateral leads (apical or LAD "wraparound" distribution). Associated T wave inversion and/or Q waves (sometimes deep) may be seen. Acute extensive STEMI-in-evolution is frequently the initial diagnosis (as it was in today's case).
  • Usually no more than modest troponin elevation (troponins are often elevated — but generally not nearly as high as expected given how marked ECG changes are).
  • Transient LV dysfunction — which may be severe initially (some patients present in pulmonary edema/cardiogenic shock requiring intra-aortic balloon pump support). LV function usually resolves within a few weeks.
  • Possibility of potentially life-threatening arrhythmias during the acute phase (including VT/Torsades de Pointes).
  • Absence of pheochromocytoma, myocarditis or other underlying cardiac pathology to explain findings.
  • Generally favorable prognosis (often with full recovery within 1 month) — but fatalities have been reported (from LV free wall rupture; intractable pulmonary edema).


NOTE: Variations on the above theme do exist. The syndrome of Takotsubo CMP is not limited to post-menopausal women — the ECG does not always show marked abnormality — and severe stress does not uniformly precede presentation.

  • Anatomic areas other than the apex may also be affected. For example — there may be an “inverted takotsubo” form, in which the apex is spared but the base of the heart is hypokinetic. The existence of such Takotsubo variants helps to explain the likely multifactorial etiology to this interesting syndrome.


PEARL: Think of the possibility of Takotsubo CMP when confronted with a patient who presents with a markedly abnormal ECG that doesn’t quite “fit” the clinical picture. 

  • ECG findings may be out of proportion to clinical findings. ECG changes may involve several lead areas (especially inferior and anterior precordial leads — which typically assess the cardiac apex).
  • There may be an element of heart failure. Serum troponins may be positive.
  • The patient is usually an older adult (especially a post-menopausal woman).
  • There has usually been some form of severe preceding “stress”.


============================

ADDENDUM (1/2/2022):

I find it easy to forget about Takotsubo Cardiomyopathy. I've observed that many clinicians have a tendency to overlook this disorder. In the hope of serving as a helpful reminder — I've summarized in Figure-3 below, the ECG Findings that might be expected in Takotsubo Cardiomyopathy (adapted from Namgung in Clin Med Insights Cardiol). 


Figure-3: ECG Findings in Takotsubo Cardiomyopathy (adapted from Namgung in Clin Med Insights Cardiol).


============================
Related Material:
  • For another case of Takotsubo Cardiomyopathy — Please see the March 25, 2020 post in Dr. Smith's ECG Blog. Please check out My Comment at the bottom of the page!


Monday, June 11, 2012

ECG Blog #45 — Muscular Dystrophy?

The ECG shown was obtained from a 22-year-old man in a wheelchair. 
  • How would you interpret the tracing? 
  • Can you think of a clinical entity that might account for this clinical scenario? 

Figure-1 - 12-lead ECG obtained from a 22-year-old man in a wheelchair. What clinical entity is suggested? 


INTERPRETATION: The ECG shows sinus rhythm at about 70/minute. The PR interval is normal – but the QRS is prolonged to at least 0.12 second. QRS morphology in the 3 key leads (I,V1,V6) is not consistent with either left or right bundle branch block. Therefore — we would classify the conduction defect as nonspecific IVCD (IntraVentricular Conduction Delay). 
  • Continuing with the interpretation — We note marked LAD (left axis deviation) consistent with LAHB (Left Anterior HemiBlock). QRS amplitude is markedly increased in lead aVL — although reliability of the ECG diagnosis of LVH (left ventricular hypertrophy) is reduced in the presence of conduction defects.
  • Regarding Q-R-S-T Changes — there are deep and wide Q waves in the high lateral leads (I,aVL). In addition — there is a small q wave in lead V2. 
  • QRS morphology in lead V1 is peculiar, as there is an rSr’s’ complex. 
  • This is followed by abrupt transition by lead V2, in which a disproportionately tall R wave is noted. 
  • R wave amplitude drops off by lead V3 — with persistent S waves seen throughout the remaining precordial leads. 
  • There is ST segment depression in lateral leads I and aVL which may reflect ‘strain’ from suspected LVH. That said — ST-T wave changes do not appear to be acute. 
=======================

IMPRESSION: This ECG is clearly abnormal and highly unusual for a young adult. Given the history of a “22-year-old man in a wheelchair” should suggest the possibility of a cardiomyopathy such as Duchenne Muscular Dystrophy (DMD). There are over 20 different genetic forms of muscular dystrophy — of which DMD is the most common of these rare disorders. DMD is almost exclusively seen in males, with unfortunate outcome of progressive muscle deterioration and weakness that invariably leads to death at an early age.
  • Cardiac involvement is the rule with most muscular dystrophies. The most common ECG abnormalities in DMD (and in other muscular dystrophies) include the following: i) QRS widening from conduction defects (usually nonspecific IVCD); ii) Abnormal Q waves not due to infarction (especially in lateral leads); and, iii) A polyphasic rSr’s’ in lead V1 — often with surprisingly tall anterior precordial R waves. All of these features are seen in Figure-1 !

  • Please Click on Figure-2 below for brief review of clinical and ECG features of Duchenne, Becker, and other muscular dystrophies.

Figure-2 - Clinical and ECG features of Muscular Dystrophy.


=======================
ACKNOWLEDGMENT: My appreciation goes to Dr. Harsha Nagarajarao (of Cardiology Boards) for allowing me to use this tracing.
=======================


Friday, June 1, 2012

ECG Interpretation Review #44 (AFib - Flutter - Artifact - Parkinson - Tremor)

The lead II rhythm strip shown in Figure 1 was observed on telemetry. 
  • Is the patient in atrial flutter?

Figure 1 – Lead II rhythm strip observed on telemetry. Is this atrial flutter?


INTERPRETATION: At first glance — one might be tempted to say atrial flutter was present. However, more careful inspection suggests that the baseline deflections do not represent atrial activity at all. In adults — atrial activity with atrial flutter is almost always regular at a rate of between 250-to-350/minute. Typically it manifests a “sawtooth” pattern in lead II. The deflections in question for this example are more geometric in configuration (ie, vertical) – they are irregular — and they far exceed the expected rate range for atrial flutter in an adult because they occur at a rate of between 400-to-500/minute. A look at the patient confirmed that these small amplitude vertical deflections were the result of tremor artifact. 
  • It is difficult to determine what the true rhythm in Figure 1 really is. The rate (95-to-100/minute), apparently normal QRS duration, and near regularity of the rhythm suggest a sinus etiology. 
  • That said – from this tracing alone, one could not rule out the possibility of either accelerated junctional rhythm (since no definite P waves are seen) — or atrial fibrillation (since there is a slight irregularity to the rhythm). 
  • IF there was a need to know clinically — one could either attempt to repeat the rhythm strip or obtain a 12-lead ECG in the hope that other leads might be less distorted by artifact. 
------------------------------------------------------- 
About ARTIFACT: Although admittedly devious on our part to show artifact in our Blog – we intentionally do so because: 
  • Artifact is an extremely common finding in the real world. 
  • Patients have been medicated, and even cardioverted or defibrillated when artifact has not been recognized or has been misinterpreted. 
  • Familiarity with the common types of artifact encountered, and attention to a few basic points usually makes recognition easy. 
  • Failure to actively include the possibility of artifact into your differential greatly increases the chance of it being overlooked. 
BOTTOM LINE: Suspect artifact whenever physical or electrocardiographic findings do not “fit” with the arrhythmia diagnosis being contemplated. Thus, a chaotic pattern without any organized activity cannot be ventricular fibrillation if the patient remains awake and alert. Similarly, deflections occurring at a rate of 400-to-500 times/minute (as shown in Figure 1) are far too rapid to be atrial flutter — especially in view of the morphology, irregularity, and clinical history (of tremor) in this case. 
  • PEARL: Parkinsonian tremor typically occurs at a speed of 4-to-6 cycles per second. This is close to the speed of atrial flutter — so the two entities may easily be confused. KEY distinguishing features of Parkinsonian tremor are: i) irregularity of tremor deflections; ii) more geometric appearance (up-and-down) than “sawtooth”; and, iii) the patient will manifest tremor … 
----------------------------------------------------

Thursday, May 17, 2012

ECG Interpretation Review #43 (AFib - PACs - Acute MI - STEMI - "smiley" - reciprocal changes)

The 12-lead ECG shown in the Figure was obtained from an older woman who was extremely anxious about her home situation. She felt some “heart sensations”. 
  • Is she in atrial fibrillation? 
  • Is anything else going on? 

Figure 1 – 12-lead ECG from an older woman with anxiety and “heart sensations”. Is she in atrial fibrillation? – NOTE – Enlarge by clicking on Figures – Right-Click to open in a separate window.
------------------------------------------------------- 
INTERPRETATION: At first glance – the patient appears to be in atrial fibrillation. The rhythm in Figure 1 is irregular, and normal upright P waves are not seen preceding each QRS complex in lead II. That said – artifact is present, and there is some baseline wander in lead II.
  • Ideally there would be a simultaneously-recorded lead II rhythm strip available for rhythm determination …
  • Even without a lead II rhythm strip – We feel this is not AFib (Atrial Fibrillation). Figure 2 explains why.  
------------------------------------------------------- 
Figure 2 – Despite irregularity of the rhythm and lack of a consistently upright P wave in lead II – this is not AFib. We have added red arrows to the ECG from Figure 1 showing clear evidence of atrial activity in other leads (See text).
------------------------------------------------------- 
DISCUSSION OF FIGURE 2: Addition of red arrows to the ECG shown in Figure 1 strongly suggests that despite the irregular appearance in lead II – the underlying rhythm is sinus:
  • Note that the overall rhythm becomes fairly regular after the first few beats (the main irregularity being beats #2,3,4 in lead II …). 
  • Careful inspection before the QRS complex in lead aVF and in lead V4 does suggest the presence of an upright P wave with fixed PR interval (red arrows in these leads). 
Thus, although impossible to know for sure without a longer lead II rhythm strip – We strongly suspect an underlying sinus mechanism with frequent PACs (Premature Atrial Contractions) as the rhythm. 
  • The occurrence of frequent PACs is clearly one cause of “heart sensations”. 
  • Up to half of all patients with AFib have the intermittent form (= PAF = Paroxysmal Atrial Fibrillation). Patients with PAF often manifest a series of PACs prior to precipitation of sustained AFib (presumably when one of the PACs falls within the atrial vulnerable period and “sets off” the episode of AFib) – so it is of course possible that the older woman in this case was having intermittent episodes of AFib … 
------------------------------------------------------- 
Is Anything Else Going On?
Much more than the rhythm – there are other concerns about the ECG in Figure 1, obtained from this older woman with anxiety and “heart sensations”. Continuing on with our systematic interpretation we note: 
  • The PR, QRS and QT intervals are normal. 
  • The mean QRS axis is normal (at about +60 degrees). 
  • There is no chamber enlargement. 
  • Assessment of Q-R-S-T Changes reveals definite abnormalities (Figure 3): 
------------------------------------------------------- 
Figure 3 – We have labeled Figure 1 to illustrate ST-T wave abnormalities in this older woman with “chest sensations” (See text).
------------------------------------------------------- 
Assessment of Q-R-S-T Changes: 
Especially when assessing complex tracings such as this one – it is best to systematically complete Descriptive Analysis (making note of all findings seen) – before attempting to render a Clinical Impression. Only in this way will you avoid overlooking potentially important findings. We note the following: 
  • Q Waves: – Q waves are present in the inferior (II,III,aVF) and lateral precordial (V5,V6) leads. The Q waves in leads III and aVF are relatively deep and wide. The Q wave in lead V6 is wider than anticipated for a normal septal q wave. 
  • R Wave Progression: Transition occurs at a normal point (between leads V2-to-V3) – however, there is a fairly abrupt increase in R wave amplitude in lead V3. 
  • ST and T Wave Changes: The most concerning finding on this tracing is ST segment elevation in each of the inferior leads. Although the amount of ST elevation varies from beat-to-beat in simultaneously recorded leads II and III (due to baseline wander) – the finding of coved ST elevation above the PR segment baseline is unmistakable (horizontal red lines in in the inferior leads of Figure 3). 
  • There is also a hint of ST elevation in lead V6. This is subtle (red line in V6) – and suggested more by shape of the ST segment in lead V6 (which looks to be elevated) – rather than by amount of ST elevation (which at most is minimal). Baseline wander in lead V6 makes ST-T wave assessment especially challenging in this lead. 
  • Support that the above findings are truly acute is forthcoming from the presence of reciprocal ST segment depression in multiple leads (I,aVL; V2,V3,V4). 
  • An additional subtle reciprocal change is disproportionate peaking of the T wave in leads V3 and V4. 
------------------------------------------------------- 
CLINICAL IMPRESSION: 
Each of the findings we note above in our Descriptive Analysis of Q-R-S-T Changes contributes in this case to our Clinical Impression: 
  • We are strongly suspicious of acute evolving infero-postero-lateral MI. Although impossible to “date” the infarction in this case (lack of a history of new-onset chest pain) – there clearly is ST elevation suggesting possible benefit from acute reperfusion. This should be considered as a possible intervention within the context of this case (perhaps assisted by serial tracings, troponins, comparison with prior tracings, and this patient’s clinical course). 
  • ST elevation in all 3 inferior leads (II,III,aVF) suggests acute inferior MI. 
  • The fact that inferior Q waves are deep and wide – and – the lack of a definite history of new-onset chest pain makes us question “how acute” these changes are … 
  • That said – the presence of definite reciprocal ST depression in several lead areas (blue circles in leads I,aVL,V2,V4 of Figure 3) supports the possibility that STEMI (ST-Elevation Myocardial Infarction) may be acutely evolving. 
  • ST depression in leads V2,V3 suggests acute posterior involvement. Supporting this finding is the abrupt increase in R wave amplitude between V2-to-V3 and the disproportionately tall T waves in V3,V4. Because none of the standard 12 leads directly view the posterior wall – we generally infer posterior involvement when the clinical setting is “right” (ie, associated inferior MI – since both inferior and posterior walls of the left ventricle are usually supplied by the right coronary artery) – and – when the “Mirror Test” is positive (See Figure 4 below). 
  • Awareness that a “left dominant” circulation may be present in the minority of patients whose right coronary artery is relatively smaller – increases our index of suspicion for associated lateral precordial involvement in Figure 3. That is, in approximately 10% of patients – it is the left circumflex artery that is dominant – wrapping around the lateral wall to continue on while supplying blood flow to the posterior and inferior walls of the left ventricle. Thus, in the context of a deeper-and-wider-than-expected Q wave in lead V6 in association with a hint of ST elevation in this lead – we suspect acute infero-postero-lateral MI in Figure1. 
------------------------------------------------------- 
Figure 4 – We illustrate the concept of “mirror-image” reciprocal deflections by means of the colored inserts in leads I,aVL,V2,V3,V4 (See text).
------------------------------------------------------- 
Figure 4: The “MIRROR Test” – for Posterior MI/Reciprocal Changes: 
The concept of reciprocal changes is based on the simplified assumption that the left ventricle acts as a cylindrical structure. With acute injury (from acute coronary occlusion) – ST segments elevate in leads directly over the area that is infarcting. In opposite areas of the heart – instead of ST elevation, there is “reciprocal” ST depression. Given the basic cylindrical structure of the left ventricle – reciprocal changes may be seen in any non-infarcting lead area, since all walls are in a sense “opposite” to one another. Thus, ST depression in lateral limb (I,aVL) and anterior (V2,V3,V4) leads in Figure 4 may reflect “reciprocal changes”. 
  • The posterior wall of the left ventricle sees “mirror-image” opposite electrical activity compared to the anterior wall. As shown by the colored inserts in leads V2,V3 of Figure 4 – instead of an RS complex with ST depression – the mirror-image in V2,V3 shows a Q wave, ST elevation and deep symmetric T wave inversion. The “mirror image” of the abrupt increase in R wave amplitude by V3 is a deepening Q wave – and the “mirror-image” of disproportionately tall T waves in V3,V4 is deep symmetric T wave inversion. In the setting of associated acute inferior MI – these changes are virtually diagnostic of accompanying acute posterior MI. 
  • Realizing that “reciprocal” ST segment depression is merely the mirror-image of ST elevation in another area of the heart helps with recognition. Note the mirror-image appearance of the QRST complex for the colored inserts in leads I and aVL of Figure 4. There can be little doubt that the ST depression in these high lateral leads represents reciprocal changes occurring in association with this patient’s acute inferior MI. 
------------------------------------------------------------------------------
BOTTOM LINE: Many of the changes in this case are subtle and represent advanced concepts. At the least – the “take home” messages from this interesting case study are the following: 
  • The cause of “heart sensations” in this older woman with anxiety but no chest pain is not AFib. Instead – her underlying rhythm is sinus with PACs. 
  • Some of this patient’s “heart sensations” probably relate to her acute inferior MI. Although lack of clear history (no definite onset of chest pain) precludes determination of the age of her MI – the presence of inferior ST elevation with reciprocal changes in several other lead areas strongly suggests at least relatively recent onset (that may therefore potentially benefit from acute reperfusion). This needs further evaluation. 
  • Whether the deep and wide Q waves that are already present in leads III and aVF represent prior inferior MI in this older patient (with superimposed new inferior injury) – or – ongoing damage from her acute event that continues to evolve – or – some combination of these possibilities – is impossible to know for sure from the “snapshot” we are given in Figure 1. Time, serial tracings and troponins, exam findings and clinical course will be needed to sort this out. 
  • In addition to the inferior wall – other areas of the heart may be involved (posterior and possible lateral precordial area). Regardless of whether ST depression in V2,V3,V4 respresents reciprocal changes – associated posterior infarction – or some combination of these two possibilities is much less important than awareness that the findings of significant ST elevation with associated ST depression in multiple leads signals involvement of a relatively larger area of myocardium (with more urgent need for immediate attention). 
---------------------------------------------------- 

NOTE: - Relevant PDF on ECG diagnosis of acute MI:
---------------------------------------------------- 

Thursday, May 3, 2012

ECG Interpretation Review #42-BIS (Tables and Figures for Blog #42)


Supportive Tables and Figures for ECG Blog #42:
  • Included below are all Tables and Figures we refer to in ECG Blog #42. By offering them separately here - We hope to facilitate side-by-side viewing as you read through Blog 42. (Please also check out the relevant PDFs we provide links for below for full interactive discussion and more on the differentiation of WCT Rhythms):
 
==========================

Figure 1: 12-lead ECG obtained from a patient whose BP was dropping. Click HERE to return to ECG Blog #42.


==========================
  
Table 1: One should always assume VT until proven otherwise whenever you encounter a regular WCT without sinus P waves. Statistically – at least 80-90% of all regular WCT rhythms of uncertain etiology will turn out to be VT (which is why we list VT for the first 8-out-of-10 causes on this list). Less commonly – one may see a supraventricular etiology with either preexisting bundle branch block or aberrant conduction.


==========================

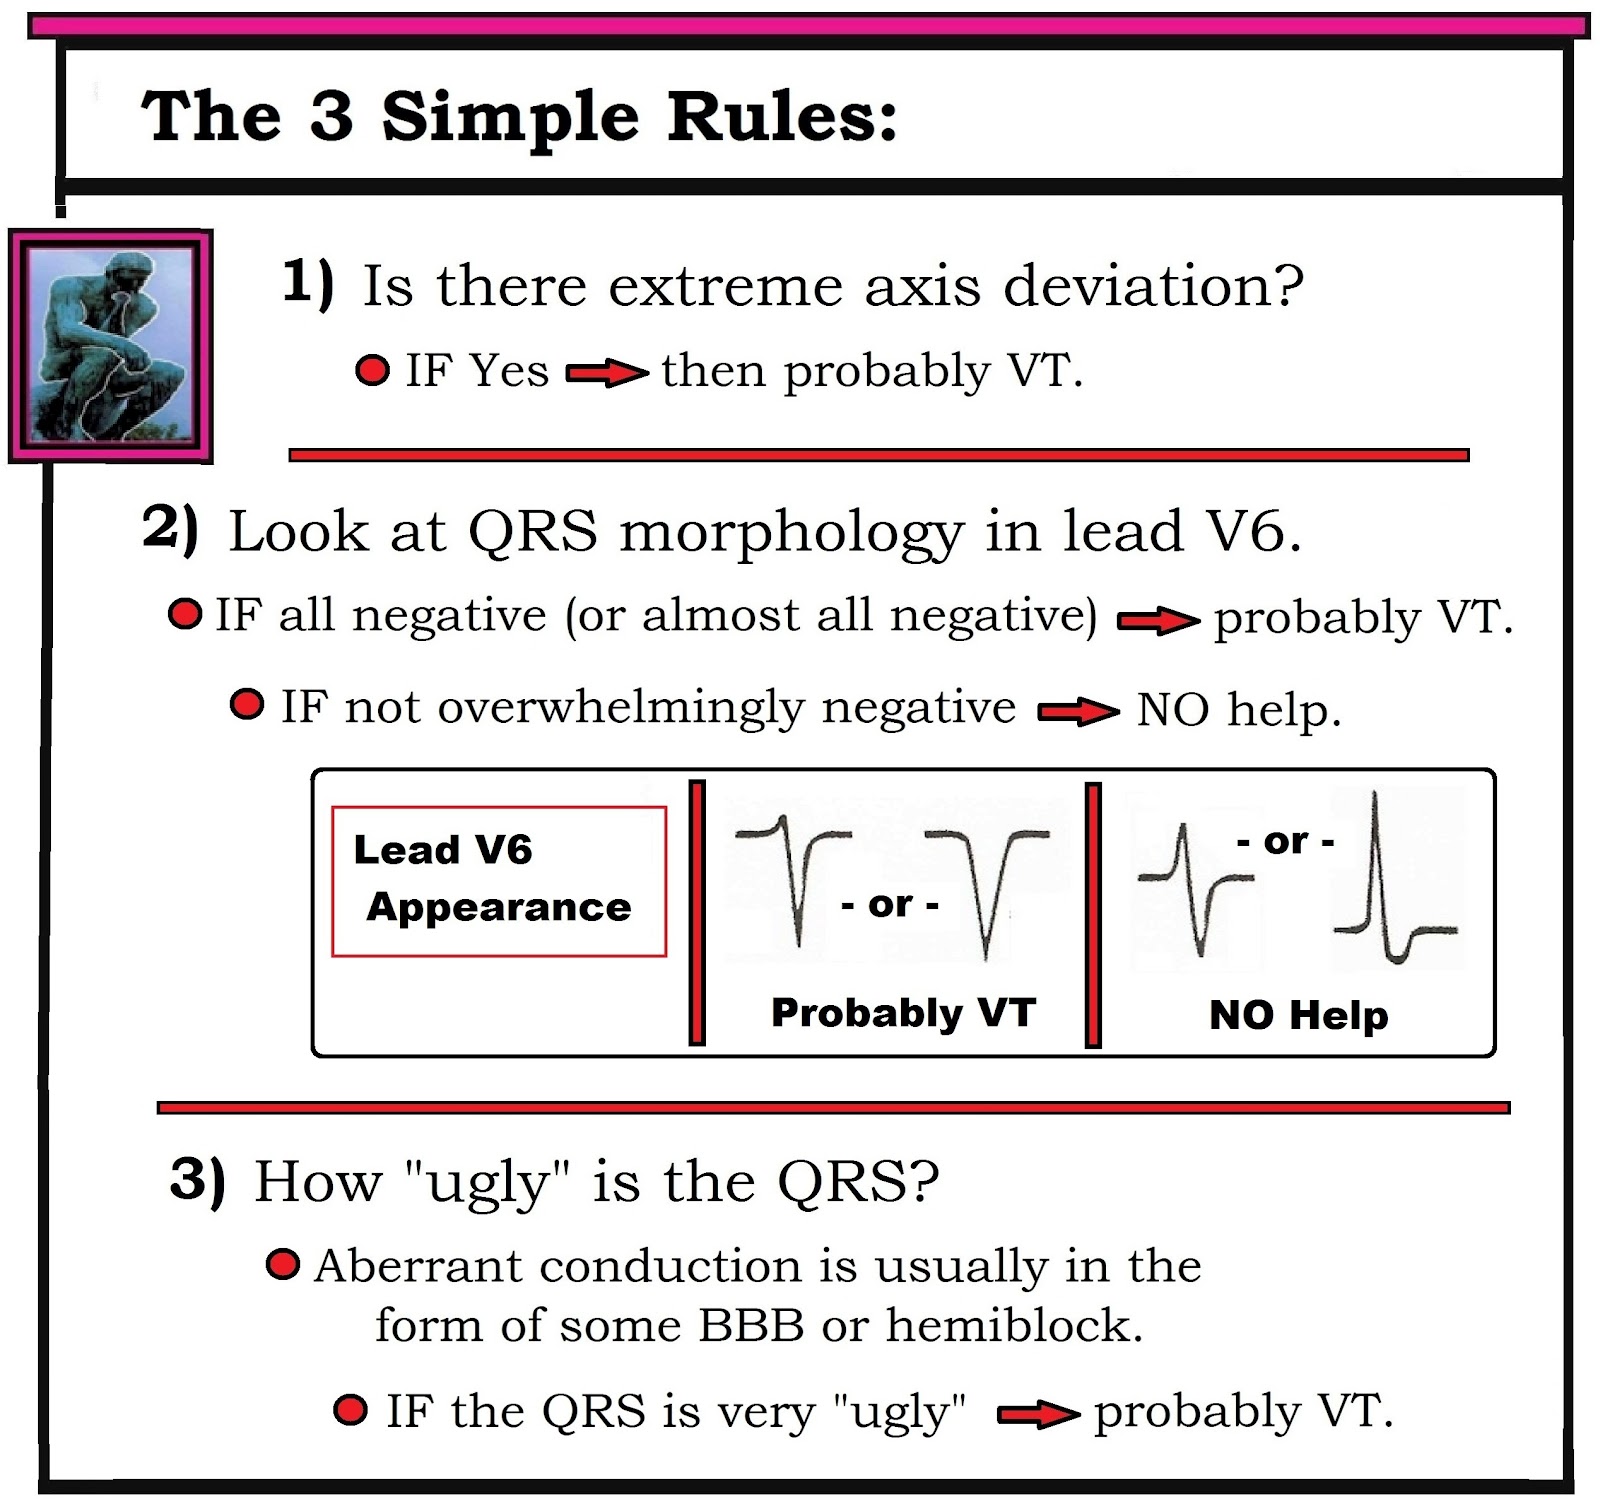
Table 2: After applying Table 1 (ie, "Assume VT until until proven otherwise) - we move to the 3 Simple Rules - which in our experience is often all that is needed for near-definitive diagnosis.


==========================

Figure 2: Attention to selected ECG features of QRS morphology may be helpful in ruling in or out VT. We focus on leads V1 and V6. The presence of either an entirely negative QS in lead V6 (complex J) or an almost entirely negative complex (I) – is highly suggestive of VT. In contrast – greater positivity in lead V6 (G,H) is nondiagnostic. Aberrant conduction is suggested by a typical rsR’ (taller-right-rabbit-ear) morphology in lead V1 (A,B). The presence of any other predominantly upright complex in lead V1 strongly suggests VT (C,D,E,F). We intentionally exclude reference to LBBB aberration in this figure – because both VT and SVT may manifest WCT rhythms that resemble LBBB.


==========================

Figure 3: The finding of a delayed R-to-S nadir (to >0.10 second) in any precordial lead is highly suggestive of VT (1st example taken from lead V2). The absence of a delayed R-to-S nadir in any precordial lead is nondiagnostic. Shown above is an example (from lead V4) in which the very slender initial r wave and steep S wave downslope result in an R-to-S nadir that clearly does not exceed 0.10 second.


==========================


Figure 4: The presence of a large upright R wave in lead aVR during a WCT rhythm is virtually diagnostic of VT (since this finding implies ventricular activation begins in the apex). Finding a QR complex or a small amplitude complex (2nd and 3rd examples shown) is nondiagnostic.


==========================
Selected REFERENCES:
  1. Brugada P, Brugada J, Mont L, et al: A New Approach to the Differential Diagnosis of a Regular Tachycardia with a Wide QRS Complex. Circulation 83:1649-1659, 1991.
  2. Blomstrom-Lundqvist C, Scheinman MM, Aliot EM, et al: ACC/AHA/ESC Guidelines for Management of Patients with Supraventricular Arrhythmias- Executive Summary. J Am Coll Cardiol 42:1493-1531, 2003.
  3. Vereckei A, Duray G, Szenasi G: Application of a New Algorithm in the Differential Diagnosis of Wide QRS Complex Tachycardia. Eur Heart J 28:589-600, 2007.
  4. Sasaki K: A New Simple Algorithm for Diagnosing Wide QRS Complex Tachycardia: Comparison with Brugada, Vereckei and aVR Algorithms. Circulation 120:S671, 2009.
==========================
- Back to ECG BLOG #42 - 
==========================

-  -
Please Check out the following relevant PDF Sections excerpted from ACLS-2013-ePub:
-----------------------------------------------------------------------