Saturday, December 18, 2010

ECG Interpretation Review - #4 (QT Interval, List #3, Causes of Long QT, Tachycardia, Torsades)


QUESTION: Interpret the 12-lead ECG below.
  • What is the rhythm?
  • What is the most remarkable finding on this tracing?
  • Clinically — What else may be going on?

Figure 1 — No history is available on the patient.


INTERPRETATION:  The rhythm is rapid and regular.  It appears that the R-R interval is ~2 large boxes, so that the rate is ~150/minute.  The QRS complex is narrow, and upright P waves are present in lead II with a fixed PR interval. The rhythm is therefore sinus tachycardia.
  • We fully acknowledge that it is not easy to be certain of the rhythm from inspection of lead II alone (the small upright deflection preceding QRS complexes in lead II could be a P wave, T wave, or both). Lead V1 is often the next best lead to look at when assessing a patient's rhythm — and one clearly sees a P wave with negative deflection and consistent PR interval preceding the QRS in lead V1 (thus confirming the rhythm as sinus).
Regarding Intervals: Both the PR and QRS intervals are normal.  The QT interval is difficult to measure because of the rapid rate. Typically — the QT interval is not more than half the R-R interval (but this relationship is less reliable with tachycardia).  That said — in at least several leads (such as leads V3,V4,V5) — it looks like the QT is clearly much more than half the R-R interval.  Thus despite the very rapid rate, we strongly suspect QT prolongation.
  •  List #3 (Figure 2) helps us recall the likely reasons for QT Prolongation ( = "Drugs — Lytes — CNS"). Clinical correlation is needed to determine which of these may be relevant for the patient in question.
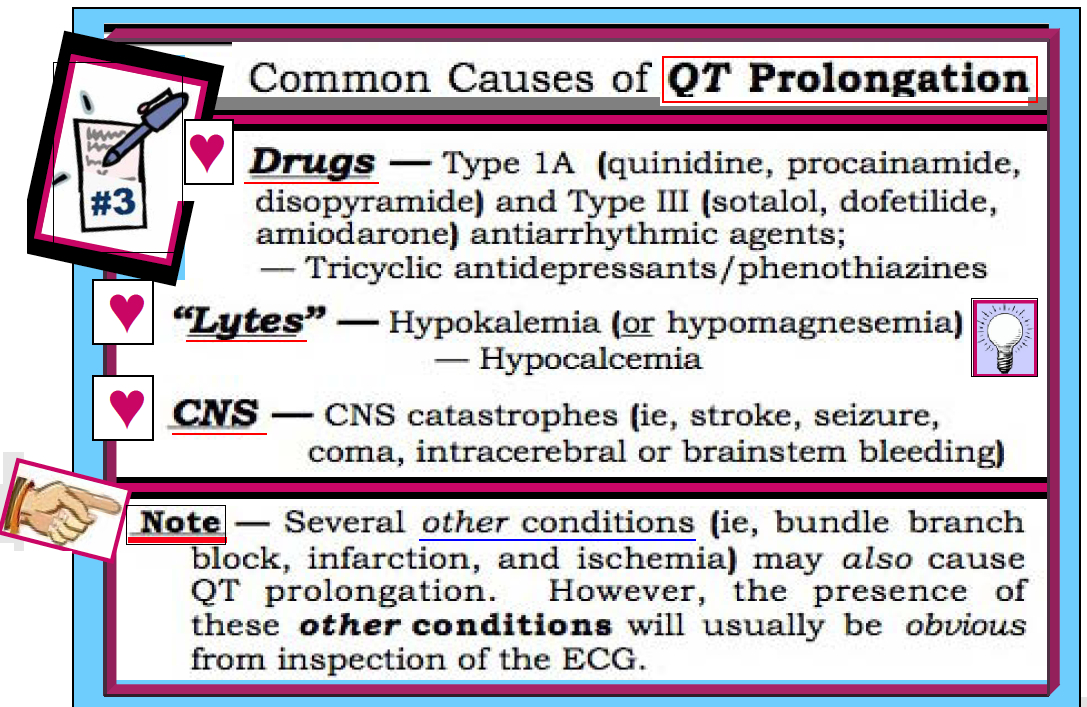
Figure 2 - Common Causes of QT Prolongation.


Returning to Our Systematic Approach: The axis in Figure 1 is normal (+15 degrees). There is no chamber enlargement. ST-T wave changes are dominated by the prolonged QT interval.


CLINICAL IMPRESSION:  We interpret this ECG as showing sinus tachycardia at ~150/minute. There are diffuse non-specific ST-T wave abnormalities — and a markedly prolonged QT interval.  Clinically — QT prolongation in the absence of infarction, ischemia or a conduction defect should make one think, "Drugs — Lytes — CNS" (the causes in List #3).

--------------------------------------------------
NOTE: See Section 06.0 from our ECG-2014-ePub for more information on Long QT and Torsades de Pointes.
--------------------------------------------------

Friday, December 17, 2010

ECG Interpretation Review - #3 (BBB, Wide QRS, BBB with ST Changes, Ischemia, RBBB vs LBBB)


QUESTION: Interpret the 12-lead ECG below.
  • What type of conduction defect is present?
  • Are ST-T waves doing what you'd expect given the presence of this conduction defect?
  • Clinically - What else may be going on?

Figure 1: What type of conducton defect is present?


INTERPRETATION:  The rhythm is sinus. The rate is slow (~50-55/minute) - with slight irregularity making this sinus bradycardia and arrhythmia. The PR interval is normal. The QRS is obviously long.  Recognition of QRS widening at this point is indication to STOP - and figure out WHY the QRS is wide before going on:
  • Assessment of QRS Widening:  - The 3 KEY leads to assess in order to determine the reason for QRS widening are leads I, V1, and V6.  Right-sided Lead V1 shows an rSR' complex (with a taller right rabbit ear).  Left-sided Leads I and V6 both have a relatively wide terminal S wave (albeit the S in lead I is modest in size).  QRS morphology is therefore consistent with complete RBBB = Right Bundle Branch Block (Figure 2).

Figure 2 - Typical Morphology for RBBB.


Returning to Our Systematic Approach: The QT interval is less relevant in the setting of BBB (BBB by itself may prolong the QT). Regarding Axis - there is no hemiblock (Other than the presence or absence of associated left anterior or posterior hemiblock - the concept of axis means little in the setting of BBB).  There is no chamber enlargement.
  • Q-R-S-T Changes - There are some relatively larger-than-expected Q waves in the lateral leads (I,V5,V6 - and especially aVL) - which could reflect infarction of uncertain age.  The tall R wave in lead V1 is from RBBB. An important finding in Figure 1 is that ST-T waves are not as one would expect for simple BBB (Figure 3).

------------------------------------
KEY Rule - Normally when there is typical RBBB or LBBB - the ST segment and T wave should be oriented opposite to the last QRS deflection in the 3 KEY leads (arrows in Figure 3). Deviation from this pattern in any of the 3 KEY leads (I, V1 or V6) is abnormal - and indicates a primary ST-T wave change (suggesting ischemia or infarction may be occurring).  

Figure 3 - ST-T Wave Changes Expected with BBB.
Note - The above KEY Rule for ST-T wave direction works only for RBBB and LBBB (but not for IVCD).
  • In Figure 1 - One would expect ST-T waves to be opposite to the last QRS deflection in the KEY leads (ie, negative in V1 - and upright in I,V6).  Instead - there is ST flattening in leads I and V1, and a negative T wave in lead V6.  Deep, symmetric T wave inversion in leads V2 thru V6 is also clearly more than what one should see with simple RBBB.
CLINICAL IMPRESSION:  We interpret this ECG as showing sinus bradycardia and arrhythmia with complete RBBB and primary ST-T wave changes.  In addition - there are Q waves in multiple leads with a clearly deeper-than-expected Q wave in lead aVL. We worry about infarction/ischemia in addition to RBBB, which could be recent or even acute. Clinical correlation is urged.
--------------------------------------------------------
   - See also ECG Blog Review #11 - and Review #13 -
   - For more on BBB please see our ECG Video on BBB BASICS -
--------------------------------------------------------

Thursday, December 16, 2010

ECG Blog #2 — "Smiley" ST Elevation


QUESTION: Interpret the 12-lead ECG below.
  • What IF this patient was a healthy, asymptomatic young adult?
  • A young adult with recent URI and pleuritic chest pain?
  • An older adult with risk factors and severe, new-onset chest pain?

Figure-1: 12-lead ECG in today's case.


INTERPRETATION:
  The rhythm is sinus at ~60/minute.  The PR, QRS, and QT intervals are normal.  We estimate the axis at +60 degrees.

  • Chamber Enlargement — The sum of the S wave in lead V2 ( =3 large boxes =15 mm) plus the R wave in V5 or V6 (~5 large boxes =25 mm) clearly exceeds 35.  This satisfies voltage criteria for LVH (provided that the patient is older than 35).
  • Q-R-S-T Changes — A Q wave and T wave inversion is seen in lead III (which as isolated findings may be normal). There are small septal q waves in leads V5,V6.  Transition is normal (occurring between leads V3 to V4). The most remarkable finding is ST segment elevation in multiple leads. ST segments manifest an upward concavity (ie, "smiley" configuration), with J-point notching (arrow in V5).

CLINICAL IMPRESSION: Our interpretation of this ECG depends on the clinical scenario. IF the patient in question was an otherwise healthy, asymptomatic young adult - then the upward concavity ("smiley" shape) ST segment elevation would be consistent with early repolarization.  IF instead the patient was older with chest pain - then despite the "smiley" shape, acute MI would have to be ruled out.  Finally - IF the chest pain was pleuritic (especially if associated with a recent URI in a young adult) - then this same ECG could reflect acute pericarditis.  Note how in each case Descriptive Analysis does not change (with our interpretation being determined in conjunction with careful consideration of the clinical setting).

--------------------------------------------------------------
      - See also ECG Blog Review #12 -
- Click on this link for more info on Early Repolarization (Look at the part beginning with Section 09.14).
--------------------------------------------------------------

Wednesday, December 15, 2010

ECG Interpretation Review - #1 (LVH, Strain, Ischemia, LAE, RAE, RVH, LAA, RAA)

 -------------------------------
QUESTION: Interpret the 12-lead ECG below.
  • Clinically - What do you suspect this patient has?
(ECG reproduced from ECG-2014-ePub - pg 40A)
- Note - Enlarge by clicking on Figures -


INTERPRETATION:  The rhythm is sinus at ~75/minute.  The PR, QRS, and QT intervals are normal.  There is RAD (predominantly negative QRS in lead I; positive in aVF).
  • Chamber Enlargement - The P wave is tall, peaked, and looks "uncomfortable to sit on" in lead II = RAA.  There is a deep negative component to the P wave in lead V1 = LAA. There is obvious voltage for LVH (the S in V2 plus the R in V5>>35).  We also suspect RVH (because of the presence of otherwise unexplained RAD in this patient who has multiple chamber enlargement).
  • Q-R-S-T Changes - are clearly consistent with LV "strain", especially in leads V5, V6 (asymmetric ST-T depression).  The fact that T wave inversion is so diffuse, tends toward being symmetric in leads I, aVL, V3 and V4 with ST coving and J-point depression in V5,V6 - suggests that ischemia may also be present.
CLINICAL IMPRESSION: We would interpret this ECG as showing sinus rhythm with RAD, LAA, RAA, probable RVH, and LVH with "strain" and/or ischemia (which is our way of acknowledging that strain and ischemia may coexist, and ST-T wave changes of one of these may mask the other . . . ).  Clinically - We strongly suspect a dilated cardiomyopathy given the multi-chamber enlargement.
-------------------------------
Note - Many use the terms LAA and LAE/RAA and RAE interchangeably.  We prefer LAA and RAA (left and right atrial Abnormality) in recognition of the fact that an abnormal-looking P wave will not always mean true atrial chamber "Enlargement".
------------------------------- 
  • For more information on LVH - Check out ECG Blog #73 - 

KG-EKG Press (Ken Grauer, MD)

Visit www.kg-ekgpress.com for materials on ECG-Arrhythmia Interpretation; ACLS.