Saturday, March 16, 2024

ECG Blog #421 — Has there been a Recent MI?


What if you were asked to interpret the ECG in Figure-1?
  • How would YOU interpret the rhythm?
  • Even without the benefit of any history — Has there been a recent MI?

Figure-1: The initial ECG in today's case. (To improve visualization — I've digitized the original ECG using PMcardio).


MY Approach to Today’s Tracing:
As always — I favor beginning assessment with a quick look at the long lead rhythm strips at the bottom of the tracing. By the Ps, Qs, 3R Approach (which I review in ECG Blog #185):
  • Lots of P waves are present — being well seen in the long lead II rhythm strip.
  • The QRS complex is narrow in all 12 leads.
  • The rhythm is not Regular. The ventricular Rate varies.
  • The 5th parameter of the Ps,Qs,3R Approach — is the 3rd R, which recalls “Related” — or determining if P waves are (or are not) related to neighboring QRS complexes. This last parameter can best be assessed by labeling P waves in the long lead II rhythm strip.


QUESTIONS:
Take a LOOK at Figure-2 — in which RED arrows highlight those P waves that are definitely seen on this tracing.
  • How would YOU describe the regularity (or lack thereof) of P waves in today's rhythm?
  • Are all of the P waves originating from the SA node?

Figure-2: I have labeled the P waves that we definitely see with RED arrows. Is the underlying atrial rhythm regular?


ANSWERS:
We see in Figure-2 — that each of the RED arrow P waves manifest a similar and normal P wave morphology — and, that each of these P waves are upright in the long lead II rhythm strip. We can therefore presume these are normal sinus P waves.
  • With the exception of 2 places in the rhythm strip where we do not see P waves at the point where we might logically expect them — Don’t the RED arrow P waves that we have labeled in Figure-2 otherwise look fairly regular?

  • NOTE: If measured with calipers — We know that the RED arrow P waves in Figure-2 are not precisely regular. But what we are trying to determine, is if there is an underlying sinus mechanism. This includes sinus arrhythmia — in which there is often slight variation in the P-P interval. This slight variation in sinus P wave regularity tends to be greater when a 2nd- or 3rd-degree AV block is present (called ventriculophasic sinus arrhythmia — as shown in ECG Blog #344).

PEARL #1: When many (most) P waves in a given tracing look regular (or at least fairly regular) — but one or two places exist in the rhythm in which P waves are not seen at the point where you expect them — it may be that additional P waves are “hiding”. As a result — I look especially carefully at QRS complexes and ST-T waves that may be hiding part (or all) of the missing P waves.
  • Is there any indication in Figure-2 — that there may be more P waves than the ones we have labeled with RED arrows?

  •     HINT: My answer is shown in Figure-3.


Figure-3: How can we know if additional sinus P waves are “hiding” under the PINK arrows?

PEARL #2: It is much easier to recognize an ECG finding — IF you know that you should be looking for it!
  • Because we know from PEARL #1 that it would be logical for the atrial rhythm to be more regular than suggested by the RED arrows in Figure-2 — we need to pay special attention to the T waves under the PINK arrows in Figure-3 (since this is where we would expect P waves to be “hiding” if the underlying atrial rhythm was sinus arrhythmia).

QUESTION:
  • Is there a difference in ST-T wave morphology for those T waves under the PINK arrows in Figure-3 — compared to all of the other T waves in this long lead II rhythm strip? (ie, Compared to the T waves of beats #1,3,4,6,7,8?).


ANSWER:
The T waves under the PINK arrows in Figure-3 are larger and clearly “fatter” than all other T waves on this tracing.
  • PEARL #3: Perhaps the greatest challenge in interpreting complex rhythms is distinguishing between “real differences” in morphology — vs artifact and/or the normal variation that is commonly seen in P wave, QRS and ST-T wave morphology.

  • The above said — Reasons I know P waves are “hiding” under the PINK arrows in Figure-3 are that: i) It is so much more logical for sinus P waves to be at least fairly regular throughout the tracing — rather than to see the SA node suddenly stop putting out impulses only in 1 or 2 places in today’s tracing; and, ii) There can be little doubt that the T waves under the 2 PINK arrows in Figure-3 are larger and “fatter” than all other T waves on this tracing.


Putting It All Together:
I find it much EASIER to assess a complex rhythm once all sinus P waves have been labeled. For clarity — I have done this in Figure-4.
  • RED arrows highlight all sinus P waves. The slight variation in the P-P interval is consistent with an underlying sinus arrhythmia.
  • Note that there are more P waves (RED arrows) — than QRS complexes in Figure-4. This means that at least some of the on-time sinus P waves are not being conducted to the ventricles — which defines today's rhythm as some form of AV block.

  • PEARL #4: Today's rhythm is not likely to be complete (3rd-degree) AV block. This is because most of the time when there is complete AV block — the escape rhythm will be regular (or at least fairly regular). 
  • In my experience — the BEST clue that a QRS complex is being conducted, is when we see a beat occur earlier-than-expected. This is why in Figure-4 — we can immediately suspect that beats #2,5,8 are being conducted to the ventricles. 
  • Since today's rhythm represents some form of AV block — but by PEARL #4, is unlikely to be complete AV block — this rhythm must represent some form of 2nd-degree AV block. Since the QRS complex is narrow — and since we know that the Mobitz I (AV Wenckebach) form of 2nd-degree AV block is so much more common than Mobitz II — we can immediately suspect that today's challenging rhythm represents some form of Mobitz I (For review of how to distinguish the 2nd-degree AV blocks — See ECG Blog #344).

Figure-4: RED arrows highlight all sinus P waves.


Important CONCEPTS:
To EMPHASIZE — I’ve intentionally dissected the above observations regarding today’s rhythm in “slow motion”. With experience — it should take no more than seconds to arrive at this point in our assessment.
  • Today's rhythm is challenging! That said, the KEY point is — that precise determination of the specific kind of AV block is not essential for appropriate clinical management. 
  • All that clinicians need do — is to recognize the following: i) That the underlying atrial rhythm is sinus arrhythmia; ii) That some form of AV block is present (because not all of the sinus P waves are being conducted); iii) But that 3rd-degree AV block is not likely (because the ventricular rhythm is not regular); and, iv) That statistically — Mobitz I 2nd-degree AV block is by far (well over 90% of the time) the most common form of 2nd-degree AV block, especially when the QRS complex is narrow, as it is in today's rhythm.

==============================
PEARL #5 (Beyond-the-Core): As an advanced point — Figure-5 illustrates how using calipers should facilitate rapid confirmation of the KEY points described above.
  • Using calipers allows us to quickly determine — that the R-R intervals between beats #2-3; 3-4; 5-6; and 6-7 are all equal! (ie, 142 msec.). However, the PR intervals before beats #4 and 7 are clearly too short to conduct! This strongly suggests that each of these beats with the same preceding R-R interval ( = beats #3,4,6,7) — is a junctional escape beat.
  • The identical R-R interval of 142 msec. that precedes each of the above junctional escape beats — corresponds to an appropriate junctional escape rate of just over 40/minute (ie, 300 ÷ 7 large boxes).
  • The reason today's rhythm is so challenging to interpret — is that the frequent occurrence of junctional escape beats serves to mask the typical progressive PR interval lengthening that we would otherwise see with Mobitz I 2nd-degree AV block.
  • That said — seeing how much earlier-than-expected beats #2,5 and 8 occur provides additional support to our supposition that these 3 beats are almost certain to be conducted, albeit with differing prolonged PR intervals. This is why todays rhythm is so challenging to interpret!

Figure-5: Using calipers allows us to quickly determine that the R-R intervals between beats #2-3; 3-4; 5-6 and 6-7 are equal!


==============================

What about Today's 12-Lead ECG?
Whereas precise determination of today's rhythm is not essential for appropriate clinical management — quickly recognizing that some form of Mobitz I 2nd-degree AV block appears to be present tremendously facilitates interpretation of today's 12-lead tracing (that I have reproduced in Figure-6).
  • Overall — there is ST segment flattening with slight ST depression in multiple leads in today's 12-lead tracing.

  • PEARL #6: The most common clinical setting for seeing the Mobitz I form of 2nd-degree AV block is acute or recent inferior and/or posterior infarction. As a result, whenever I see some form of Mobitz I — I immediately search for any possible indication of recent inferior and/or posterior OMI.

  • PEARL #7: Normally, there is a slight amount of gently upsloping ST elevation in leads V2 and V3. When instead of this gently upsloping ST elevation, there is "shelf-like" ST segment flattening — I immediately suspect recent posterior OMI, especially if the patient presents with new or recent chest pain (See ECG Blog #367 — for review of this concept).
  • Therefore — My "eye" was immediately drawn to the abnormal ST segment flattening in lead V2 (within the RED rectangle). Seeing a similar abnormal ST segment shape in neighboring leads V3 and V4 (within the light BLUE rectangles) — confirmed this as a "real" finding.
  • NOTE: Although we are not provided with any history in today's case — knowing that today's rhythm appears to represent some form of Mobitz I strongly supports my supposition that the ST segment flattening with slight depression in leads V2,V3,V4 of Figure-6 should suggest recent posterior OMI until proven otherwise!
  • The finding of additional ST segment flattening in multiple other leads may represent multi-vessel disease.
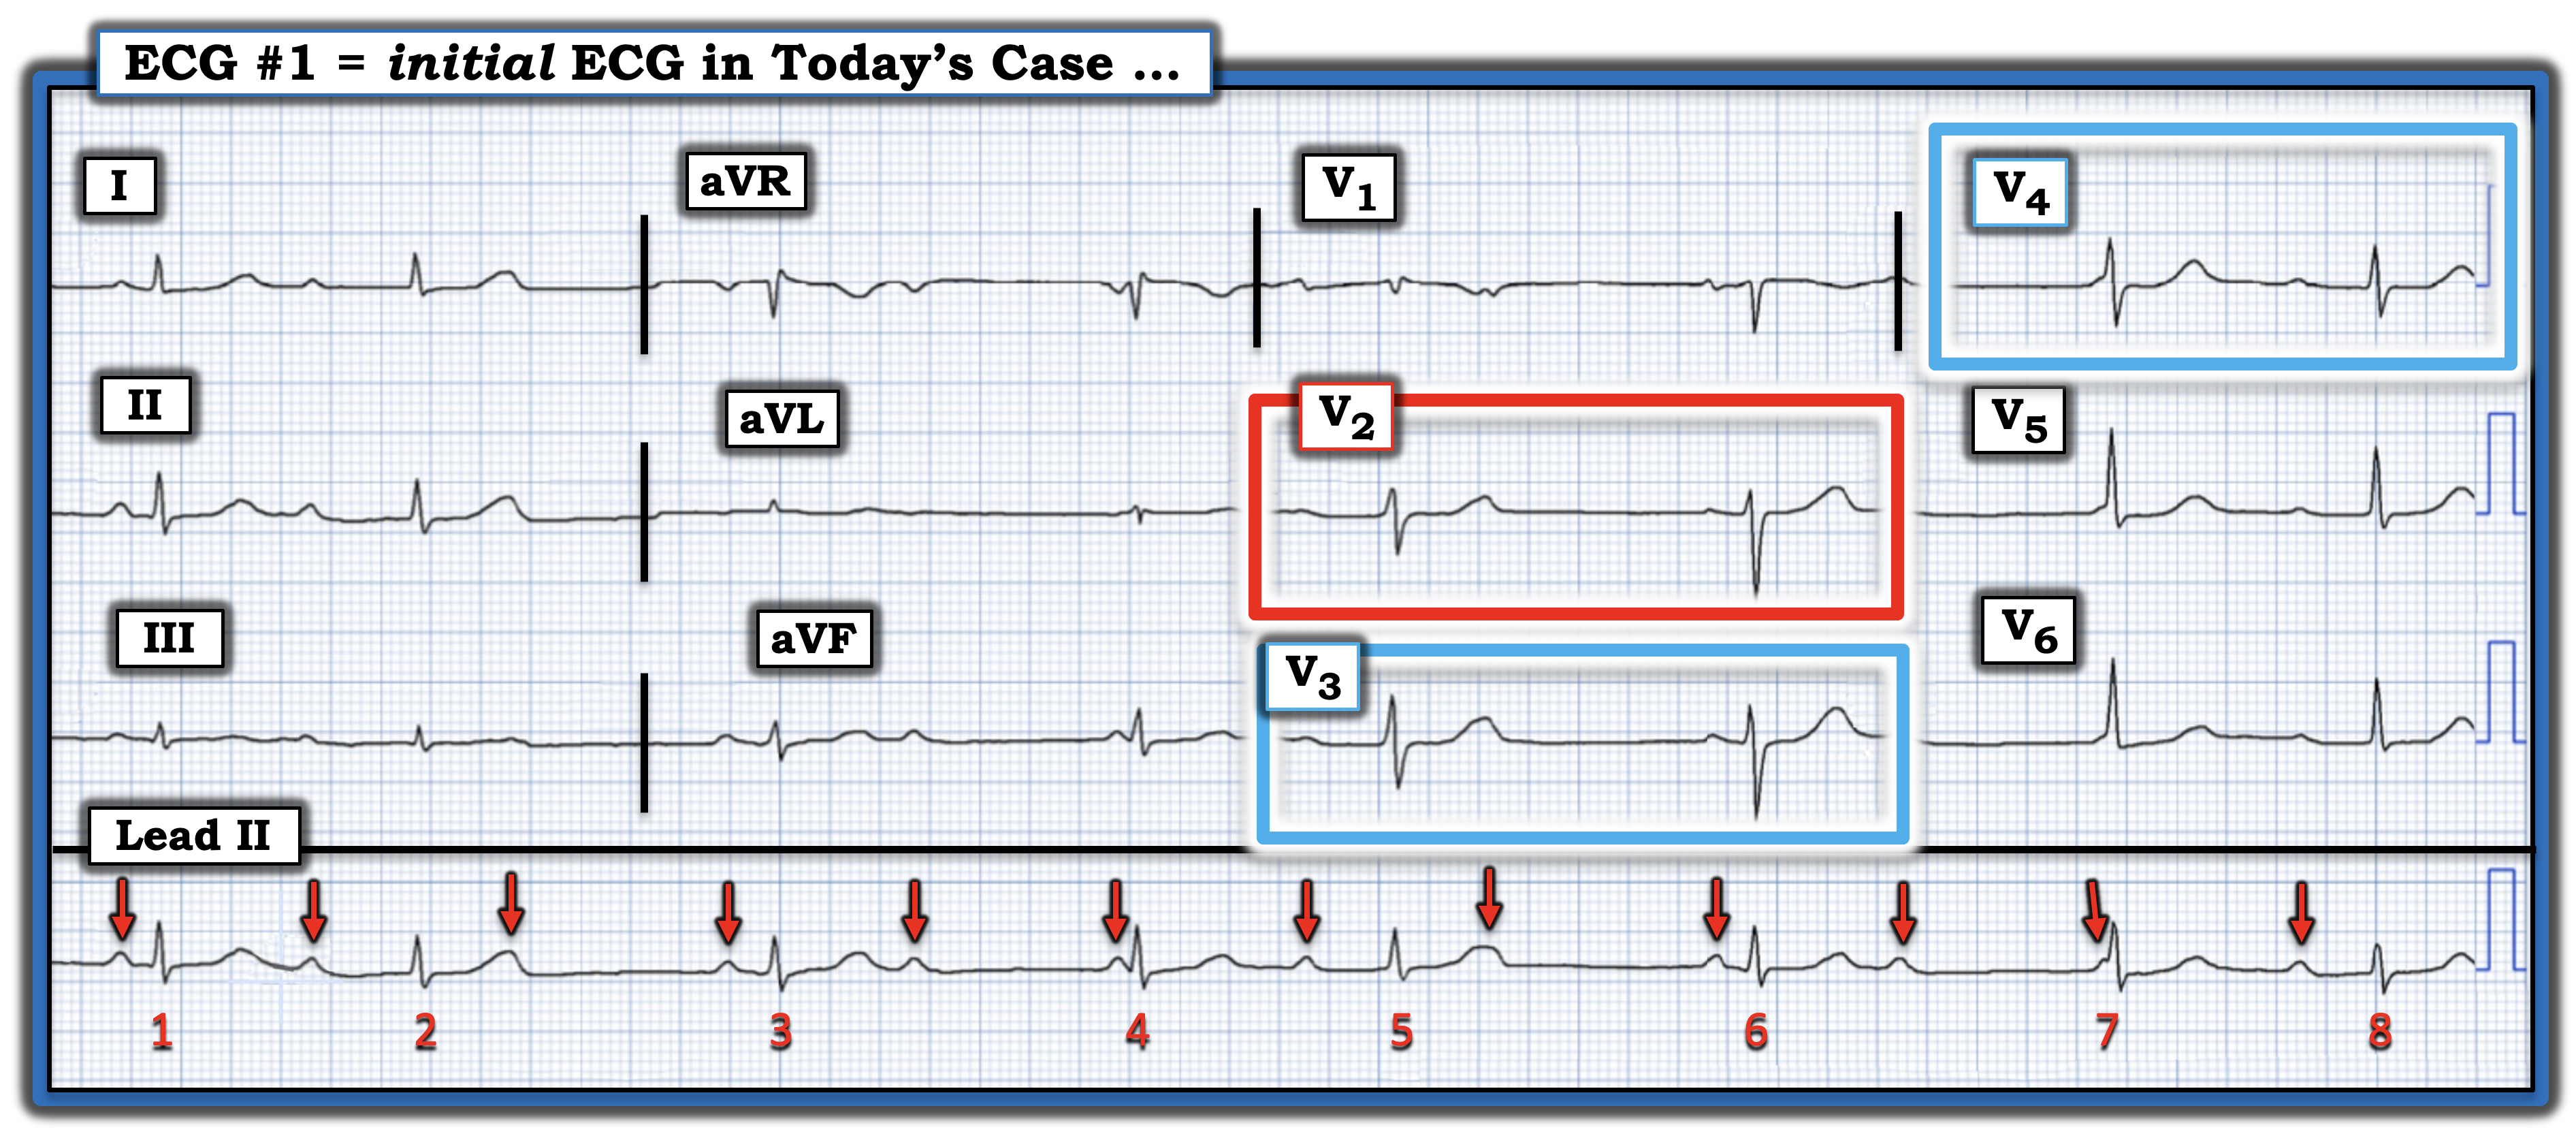
Figure-6: I've highlighted the KEY leads in today's 12-lead tracing with colored rectangles (See text).

==============================
PEARL #8 (Beyond-the-Core): There will sometimes be slight variation in QRS morphology between sinus-conducted beats and junctional escape beats. At times, this slight difference in QRS morphology provides an important clue as to whether a given beat is conducted — or — represents a junctional escape beat (See ECG Blog #63).
  • I've emphasized that although the precise mechanism of today's rhythm is complex — all that is needed for appropriate clinical management, is appreciation that some form of Mobitz I 2nd-degree AV block is present.

  • QUESTION: Did YOU notice the slight difference in QRS morphology between the 2 beats in simultaneously-recorded leads V1,V2 and V3 in Figure-6? This difference in QRS shape further supports my earlier conclusion that beat #5 (that occurs earlier-than-expected) is sinus-conducted with a long PR interval — whereas beat #6 (which is preceded by the 142 msec. R-R interval shown in Figure-5) is a junctional escape beat.
==============================

The LADDERGRAM: 
I've emphasized that although the precise mechanism of today's rhythm is complex — all that is needed for appropriate clinical management, is appreciation that some form of Mobitz I 2nd-degree AV block is present.
  • That said — I fully acknowledge that I needed a laddergram to "solve" (ie, explain) each of the ECG findings in today's tracing. I've labeled my proposed laddergram in Figure-7.

Figure-7: I've labeled my proposed laddergram in today's case.


Laddergram Explanation:
  • Beats #2, 5 and 8 are each sinus-conducted, albeit with significantly prolonged PR intervals (since each of these beats occur much earlier-than-expected).
  • Beats #3,4,6 and 7 are junctional escape beats. We arrived at this conclusion by the finding of PR intervals before beats #4 and 7 that are definitely too short to conduct — with the PR intervals before beats #3 and 6 being significantly shorter than each of the sinus-conducted beats — and, with each of these 4 beats that we presume to be junctional escape beats, being preceded by the identical R-R interval of 142 milliseconds. 
  • Although we do not see far enough in front of beat #1 to know what its preceding R-R interval is — the fact that the PR interval before beat #1 is short (and of similar duration as the PR interval preceding junctional beats #3 and 6) — suggests that beat #1 is also a junctional escape beat.
  • YELLOW arrows represent P waves that are not conducted because of the 2nd-degree AV block.
  • We have no idea whether the BLUE arrow P waves might have conducted (perhaps with an increasing PR interval) — IF the junctional escape beats ( = beats #3,4; 6,7) would not have occurred.

  • BOTTOM Line: Today's case illustrates how challenging it can be to recognize certain forms of 2nd-degree AV block of the Mobitz I type (ie, in which there are frequent junctional escape beats). That said — the overall ventricular rate of today's rhythm is between 40-50/minute, which may be enough to maintain hemodynamic stability. 
  • NOTE: We can not say there is "high-grade" AV block in today's tracing — because we never see 2 consecutive on-time sinus P waves that fail to conduct despite having adquate opportunity to do so (ie, We never see 2 consecutive YELLOW arrow P waves).
  • Clinically: The "good news" regarding today's case — is that most of the time with Mobitz I, acute reperfusion (with PCI or thrombolytics) will result in improvement of the associated AV conduction disturbance.

I conclude today's case with the laddergram shown in Figure-8 — in which I've removed the coloration from Figure-7. 


Figure-8: Today's laddergram without coloration.


==========================================

Acknowledgment: My appreciation to Danilo Franco (from Italy) for the case and this tracing.

==========================================


============================== 

Related ECG Blog Posts to Today’s Case:

  • ECG Blog #185 — My Ps,Qs,3R System for Rhythm interpretation.
  • ECG Blog #188 — Reviews how to read and draw Laddergrams (with LINKS to more than 100 laddergram cases — many with step-by-step sequential illustration).
  • ECG Blog #205 — Reviews my Systematic Approach to 12-lead ECG Interpretation.
=================================
  • CLICK HERE — for my 6 new ECG Videos (on Rhythm interpretation — 12-lead interpretation with Case Studies for ECG diagnosis of acute OMI).
  • CLICK HERE — for my 2 new ECG Podcasts (on ECG & Rhythm interpretation Errors — and — Errors in assessing for acute OMI).
=================================
  • ECG Blog #192 — The 3 Causes of AV Dissociation. 
  • ECG Blog #191 — Reviews the difference between AV Dissociation vs Complete AV Block.

  • ECG Blog #389 — ECG Blog #373 — for review of some cases that illustrate "AV block problem-solving".
  • ECG Blog #344 — thoroughly reviews the Types of 2nd-degree AV block (Mobitz I vs Mobitz II vs 2:1 AV Block).
  • ECG Blog #267 — Reviews with step-by-step laddergrams, the derivation of a case of Mobitz I with more than a single possible explanation.
=================================
  • ECG Blog #193 — Reviews the Mirror Test for recognition of acute Posterior MI. This blog post also reviews the basics for predicting the "Culprit" Artery — and use of the term, "OMI" ( = Occlusion-based MI) as an improvement from the outdated STEMI paradigm.

  • ECG Blog #367 — A must to review !!! — as this case reinforces the KEY concepts for recognizing subtle acute posterior OMI!

  • ECG Blog #294 — How to tell IF the "culprit" artery has reperfused.
  • ECG Blog #260 — Reviews when a T wave is hyperacute — and the concept of "dynamic" ST-T wave changes.
  • ECG Blog #230 — How to compare serial ECGs.
  • ECG Blog #337 — an OMI misdiagnosed as an NSTEMI ...
  • ECG Blog #285 — for another example of acute Posterior MI (with positive Mirror Test).
  • ECG Blog #246 — for another example of acute Posterior MI (with positive Mirror Test).
  • ECG Blog #80 — reviews prediction of the "culprit" artery (with another case to illustrate the Mirror Test for diagnosis of acute Posterior MI).
  • ECG Blog #184 — illustrates the "magical" mirror-image opposite relationship with acute ischemia between lead III and lead aVL (featured in Audio Pearl #2 in this blog post).
  • ECG Blog #167 — another case of the "magical" mirror-image opposite relationship between lead III and lead aVL that confirmed acute OMI.
  • ECG Blog #271 — Reviews determination of the ST segment baseline (with discussion of the entity of diffuse Subendocardial Ischemia).
  • ECG Blog #258 — How to "Date" an Infarction based on the initial ECG.
  • The importance of the new OMI (vs the old STEMI) Paradigm — See My Comment in the July 31, 2020 post in Dr. Smith's ECG Blog.


Monday, March 11, 2024

ECG Blog #420 — A "Fast" Complete Heart Block?


I was asked to interpret the 2-lead rhythm strip shown in Figure-1 — without the benefit of any history. What are YOUR thoughts?
  • Is there AV block? If so — Is it complete AV block?

Figure-1: You are asked to interpret this 2-lead rhythm strip without the benefit of any history.

======================

NOTE: Today's rhythm is challenging — especially if you have not seen this type of rhythm before. That said, attention to the sequential PEARLS I present in my discussion below can greatly facilitate recognizing this rhythm within seconds the next time you encounter it!

======================


MY Thoughts on Today’s Rhythm: 

Assuming that today’s patient is not unstable hemodynamically (and does not require immediate synchronized cardioversion) — We can completely turn our attention to assessment of the rhythm. By the Ps, Qs & 3R Approach (which I review on ECG Blog #185):

  • The Rate of the rhythm in Figure-1 is somewhat fast — averaging ~100/minute (ie, with an R-R interval close to 3 large boxes in duration for most of the tracing).
  • The rhythm is clearly not Regular. The R-R interval is not the same throughout the tracing.
  • It appears that there are at least some P waves, albeit P waves are not seen in all parts of this tracing.
  • Although the QRS complex looks wider than it normally is — the QRS does not measure more than half a large box (ie, not more than 0.10 second) in either of the 2 monitoring leads shown in Figure-1. 

PEARL #1: Remember the saying, “12 leads are better than one”. The importance of determining whether the QRS complex of a tachycardia is wide or narrow — is that IF the QRS is narrow in all 12 leads, then the rhythm is supraventricular (and we have therefore ruled out the possibility of VT = Ventricular Tachycardia). The more monitoring leads we have available — the more accurate will be our determination about whether the QRS is wide or narrow.

PEARL #2: We only see 2 of the 12 leads of an ECG in Figure-1. This is important to appreciate — since sometimes a part of the QRS complex may lie on the baseline in one or more leads. When this happens — the QRS may “look” to be narrow in the lead(s) you are monitoring, whereas in reality the QRS is actually wide.
  • It is for this reason that I always favor doing a 12-lead ECG as soon as this is feasible for any arrhythmia of uncertain etiology. Clinical management of the patient clearly differs if you can rule out the possibility of a ventricular rhythm. Unfortunately in today’s case — No 12-lead ECG was available.

Assessing the 5th Parameter:
Thus far — We’ve determined the following: 
  • That the Rate of QRS complexes in today’s rhythm is fairly fast — but not quite Regular.
  • That the rhythm is probably supraventricular (because the QRS is not more than half a large box in either of the 2 monitoring leads we are given)
  • That at least some P waves are present.

  • The remaining parameter is the 3rd R — which  is determining IF any of the P waves in today’s rhythm are Related to neighboring QRS complexes. It turns out that this last parameter is KEY to solving today’s arrhythmia.

PEARL #3: The easiest way to assess for this 5th parameter — is to see if there are any PR intervals that repeat. And the BEST way to find any PR intervals that may be repeating — is to seek out any relative pauses in the rhythm — and to check out the PR interval before each beat that ends each pause.
  • NOTE: The “pause” in the rhythm may be brief — and not much longer than the other R-R intervals. Figure-2 illustrates this principle — in which the R-R intervals between beats #4-5; 8-9; and 12-13 are slightly longer than other R-R intervals in today’s tracing.
  • RED arrows highlight the P waves that precede each of the beats that end each of these short pauses. Isn’t the PR interval before beats #5, 9 and 13 equal?

PEARL #4: An important concept in “arrhythmia problem solving” — is based on the saying, “Birds of a Feather flock Together”. By this I mean that IF you see a certain ECG finding a number of times in a given tracing — then if you see a similar phenomenon that is not quite as precise — the chances are that you are seeing the same ECG finding!
  • Take beat #1 in Figure-2 — which occurs at the very beginning of this tracing (which means that we do not know what came before beat #1). As a result, we can not know if beat #1 was preceded by a slight pause in the same way that beats #5, 9 and 13 are all preceded by a slight pause of the same duration. 
  • BUT — Given the repetitive pattern of there being a slight pause after every 4th beat (ie, “Birds of a feather …” ) — and given that the PR interval preceding beat #1 ( = first RED arrow in Figure-2) is equal to the PR interval preceding beats #5,9,13 ( = the other RED arrows in Figure-2) — this is not by chance, and whatever relationship might be occurring between atrial activity and neighboring QRS complexes for beats #5-thru-16 — is almost certain to be the same phenomenon occurring for beats #1-thru-5! 

Figure-2: Applying the concept of “Looking for a slight pause in the rhythm” — I’ve labeled the 4 P waves that we clearly see with RED arrows. Note that the PR interval for these 4 P waves is the same!

PEARL #5: It’s time to determine IF there is an underlying regular atrial rhythm — which could be the case IF some P waves are hiding within certain ST-T waves. Figure-3 illustrates How to Look for “Hidden” P waves:
  • Search the tracing looking for 2 P waves in a row that you can clearly see. RED arrows in Figure-3 illustrate 2 such P waves that are clearly seen in today’s rhythm.
  • Using the P-P interval set by these 2 RED arrows locates the next spot to search for a “P wave in hiding”. Isn’t the T wave under the WHITE arrow in Figure-3 “fatter” than most other T waves in this tracing?
  • The reason the T wave under the WHITE arrow is “fatter” — is that this is where the next consecutive P wave occurs.
  • NOTE: Using calipers greatly facilitates the process. Using calipers instantly makes you “smarter” — and allows me to “solve” an arrhythmia such as today’s tracing within seconds that providers who do not use calipers are simply not able to solve.

Figure-3: How to find “hidden” P waves (See text).


Now that we have identified the P-P interval for 3 consecutive P waves (as shown by the 3 arrows in Figure-3) — it should take no more than seconds to “walk out” where the regularly-occurring P waves are located throughout the rest of today’s tracing (Figure-4):

Figure-4: RED arrows highlight where regular atrial activity is located throughout the rhythm in today’s case.

PEARL #6: Try to determine if the underlying atrial rhythm is a “sinus” rhythm — or an ectopic atrial rhythm. This determination is not always easy to make.
  • A sinus rhythm — is defined by the presence of an upright P wave in lead II. This is because when limb lead electrodes are correctly placed — the direction of atrial depolarization as impulses arising from the SA node travel toward the AV node will be oriented close to +60 degrees in the frontal plane, which corresponds to the 60 degree electrical perspective of standard lead II in Einthoven’s Triangle.
  • Therefore — IF P waves are not upright in lead II, then the rhythm is not sinus!
  • The problem is that when P waves are upright in standard lead II (as they are in Figure-4) — then it may be difficult to distinguish between a sinus rhythm vs an ectopic atrial rhythm!

PEARL #7: Determining the atrial rate may help. In Figure-4 — the atrial rate is ~125/minute (which can be quickly estimated by the Every-Other-Beat Method reviewed in ECG Blog #210). 

  • By the Every-Other-Beat Method — Given that the P-P interval of every-other-P-wave in Figure-4 is just under 5 large boxes in duration — this means that half the atrial rate is slightly faster than 300 ÷ 5 (ie, slight faster than 60/minute) — which means the actual atrial rate is ~125/minute.

  • The PEARL: The finding of a fast and regular atrial rate in association with an irregular supraventricular (narrow-QRS) rhythm — is much more likely to represent ATach (an ectopic Atrial Tachycardia) — than sinus tachycardia. The reason for this finding, is that Wenckebach conduction is commonly seen with ectopic ATach.


======================
Proving My Theory . . .
Using calipers — I was able to prove within seconds that my suspicion of ATach with Wenckebach conduction was the answer to today's rhythm.
  • For clarity in Figure-5 — I've reproduced Figure-2, in which we see group beating (ie, beats #1-thru-4; #5-thru-8; #9-thru-12; #13-thru-16) — with each group separated by a slight pause of similar duration (ie, between beats #4-5; #8-9; #12-13) — with each pause ending with a conducted P wave (ie, the RED arrow P waves, each with an identical PR interval before beats #1,5,9,13). The repetitive pattern of these similarities can not be by chance!
  • As soon as my calipers confirmed the underlying regular atrial rhythm (RED arrows in Figure-4) — I knew today's rhythm had to be ATach with Wenckebach conduction.

Figure-5: I've reproduced Figure-2 to highlight the repetitive pattern of "group beating" in today's rhythm (See text).


Knowing (from Figure-4) where each of the underlying regular P waves are located — allowed me to focus on the 2nd P wave in each group — which I've highlighted with PINK arrows in Figure-6. These PINK arrow P waves are each conducting the 2nd QRS complex in each group of beats (ie, PINK arrow P waves are conducting beats #2,6,10 and 14).
  • Note that the PR interval of each PINK arrow P wave is longer than the PR interval before the 1st beat in each group (highlighted by each RED arrow P wave).

Figure-6: I've highlighted the 2nd P wave in each group with a PINK arrow.


Next, in Figure-7 — I focused on the 3rd and 4th P waves in each group (highlighted by light and dark BLUE arrows, respectively).
  • Note progressive lengthening of the PR interval for each of the colored arrows in each of the 4 groups!

Figure-7: I've highlighted the 3rd and 4th P waves in each group with light and dark BLUE arrows, respectively


Finally, in Figure-8 — I highlight with YELLOW arrows, the location of the next on-time P wave.
  • It is these "on-time" YELLOW arrow P waves that represent the dropped (non-conducted) P wave in each of the Wenckebach cycles in today's rhythm.
  • This is as it should be with Wenckebach conduction — in that these non-conducted YELLOW P waves occur at the beginning of the slight pause between each group — after which the following on-time P wave (ie, the next RED arrow P wave) begins a new cycle with a shorter PR interval.

Figure-8: YELLOW arrows highlight the non-conducted P wave in each group — after which the next Wenckebach cycle begins.


======================
The Laddergram . . .
The above derivation for today's rhythm is rendered easier to see in Figure-9 by use of laddergram illustration.
  • For clarity in Figure-9 — I've kept the coloration of arrows from Figure-8, to facilitate appreciation of progressive lengthening of each PR interval within each of the groups — until the 5th P wave in each group ( = the YELLOW arrow P waves) are non-conducted — followed at the end of each short pause, by resumption of conduction with PR interval shortening for the 1st beat in the next group (highlighted by each RED arrow P wave).

Figure-9: Laddergram illustration of today's rhythm.


Figure-10 is what today's laddergram looks like without coloration.

Figure-10: Final laddergram.


======================
FINAL Thoughts on Today's Rhythm:
As per my Note at the beginning of today's case — today's rhythm is a challenging one if you have not seen this entity before. But once you are aware of this arrhythmia presentation — it becomes EASY to recognize within seconds of seeing the tracing.
  • Repetitive patterns are unlikely to be due to chance! Cement this concept in your mind by going back to the original tracing (which is why I once again show Figure-1 below, without any P waves labeled).

  • As you now take another LOOK at this initial tracing — Isn't it now easier to appreciate group beating with a repetitive pattern of similar intervals — in which each of the short pauses are terminated by easily-identifiable P waves with the same PR interval before beats #1,5,9 and 13?
  • IF you used calipers to facilitate recognizing these relationships — Wasn't it EASY to establish within seconds these similarities in intervals?

  • BOTTOM Line: Once you recognize that today's rhythm is supraventricular — with group beating — and with fast, regularly-occurring P waves — that show clear conduction of the 1st P wave at the end of each pause — you have essentially established that the rhythm is ATach with Wenckebach conduction.
  • Today's rhythm is not complete AV block — because complete ( = 3rd-degree) AV block is most often associated with a regular escape rhythm — and the ventricular rhythm in Figure-1 is clearly not regular!
  • The "good news" — is that most of the time when ATach is associated with the group beating pattern of 2nd-degree AV Wenckebach — the conduction defect usually resolves once the ATach is controlled.

Figure-1: Take another LOOK at today's rhythm!


==================================
Acknowledgment: My appreciation for the case and this tracing that was anonymously sent to me for my opinion.
==================================

Related ECG Blog Posts to Today’s Case:
  • ECG Blog #185 — reviews the Ps, Qs & 3R Approach (Listen to Audio Pearl #3 in this post).
  • ECG Blog #188 — Reviews how to read and draw Laddergrams (with LINKS to more than 90 laddergram cases — many with step-by-step sequential illustration).
  • ECG Blog #267 — Reviews with step-by-step laddergrams, the derivation of a case of Mobitz I with more than a single possible explanation.

  • ECG Blog #210 — for review of the Every-Other-Beat Method for rapid estimation of heart rate (See Video Pearl #27 in this post).

  • ECG Blog #229 — reviews distinction between AFlutter vs ATach.
  • The November 12, 2019 post in Dr. Smith's ECG Blog — in which I review my approach to a Regular SVT rhythm.


Saturday, March 2, 2024

ECG Blog #419 — The Cause of ECG #1?


I was sent the 2 ECGs shown in Figure-1 — which were recorded from an elderly man whose heart beat "has been irregular for years". No clear history for recent chest pain — but the patient "has not been well" for the previous week. Regarding the 2 ECGs in Figure-1: 
  • ECG #1 is the initial tracing obtained at the scene by the EMS (Emergency Medical Systems) team — in association with an alert but markedly hypotensive patient.
  • ECG #2 was recorded a short while after ECG #1 by the EMS team — but before any treatment other than ASA was given. As might be imagined — the patient suddenly "felt much better".

QUESTIONS:
  • How would YOU interpret these 2 ECGs?
  •   — How might ECG #2 be related to ECG #1?

Figure-1: The 2 ECGs in today's case. (To improve visualization — I've digitized the original ECG using PMcardio). 


MY Thoughts on the 2 ECGs in Figure-1:
Even without a long lead rhythm strip — it is easy to understand why today's patient was markedly hypotensive in association with ECG #1.
  • Atrial activity is present in ECG #1 — in the form of seemingly regular upright P waves in each of the inferior leads — at a regular rate of ~115/minute. 
  • I suspect that none of the P waves in ECG #1 are conducted.
  • Detection of atrial activity is much more difficult in the chest leads due to a large amount of baseline artifact — although evidence of atrial activity at a similar rate is seen toward the end of lead V1.
  • The above said — intermittent ventricular complexes of varying morphologies are seen (albeit with much distortion from artifact).
  • The longest pause occurs in simultaneously-recorded leads aVR,aVL,aVF — with no ventricular complex seen after the 1st beat in these leads until the lead change to V1,V2,V3 occurs (ie, almost 12 large boxes = 2.4 seconds later). We have no idea how long the pause was before the 1st beat in ECG #1 was recorded.

  • Clinical IMPRESSION: I would interpret ECG #1 as suggestive of near ventricular standstill — with underlying atrial tachycardia, extended pauses, and no reliable ventricular escape focus. This is often a pre-lethal rhythm.

  • PEARL #1: The rhythm in ECG #1 is more than just "complete AV block". This is because in addition to no conduction of any of the sinus P waves — the presence of a fairly regular escape pacemaker that is usually seen with complete AV block is absent. Instead, we see extended pauses that are intermittently interrupted by irregular (and unreliable) ventricular complexes arising from different ventricular sites.

Before any treatment — ECG #2 was recorded:
  • Normal sinus rhythm has spontaneously returned! Interestingly — the rate (and morphology) of sinus P waves is virtually unchanged with respect to the unconducted P waves that were seen in ECG #1, the difference being that there is now 1:1 conduction of sinus impulses with a normal PR interval!

NOTE: The QRS complex of conducted beats in ECG #2 is wide. QRS morphology is interesting in that it resembles RBBB (Right Bundle Branch Block) conduction in the chest leads — but LBBB (Left Bundle Branch Block) conduction with marked left axis in the limb leads. 

  • The tall R wave (qR morphology) in lead V1 of ECG #2 — in association with a fairly wide terminal S wave in lead V6 — suggests RBBB conduction.
  • The predominantly upright widened QRS complexes in leads I and aVL of ECG #2 — suggests LBBB conduction — with the predominantly negative QRS complexes in each of the inferior leads indicative of marked LAD (Left Axis Deviation).

PEARL #2: As described in ECG Blog #394 — QRS widening in the presence of sinus rhythm, in which QRS morphology is consistent with RBBB conduction in the chest leads — but LBBB conduction in the limb leads (especially with a leftward axis) — suggests the entity known as MBBB (Masquerading Bundle Branch Block). This is precisely the picture of the QRS morphology that we see in ECG #2.
  • I review my user-friendly approach to the ECG diagnosis of the Bundle Branch Blocks in ECG Blog #282 — and to Hemiblocks and Bifascicular Blocks in ECG Blog #203. In brief — the 3 KEY leads that allow accurate diagnosis of RBBB and LBBB within seconds (!) — are right-sided lead V1 and left-sided leads I and V6.
  • Supraventricular conduction defects not consistent with either RBBB or LBBB in all 3 of these key leads are most easily classified as IVCD (IntraVentricular Conduction Defect) — with this category representing the "end result" of a number of different pathophysiologic processes.

  • MBBB is a special type of IVCD that although uncommon, is important to recognize because it identifies a group of patients with: i) Very severe underlying heart disease; ii) A much higher predisposition for developing complete AV block (and needing a pacemaker); and, iii) An extremely poor longterm prognosis.

  • NOTE: Variations on this above "theme" of MBBB are common. Thus, the S wave that is typically associated with RBBB patterns in lateral chest leads V5,V6 may or may not be present. In the limb leads, rather than a strict LBBB pattern — more of an extreme LAHB (Left Anterior HemiBlock) pattern may be seen (ie, with wide and predominantly [if not totally] negative QRS complexes in the inferior leads — and with a smaller [blunted] terminal s wave in leads I and aVL).

PEARL #3: Knowing the clinical history may aid in recognition of IVCD patterns that are consistent with MBBB (ie, if the patient has a known history of severe, underlying heart disease). 
  • Distinction from simple bifascicular block (ie, with RBBB/LAHB) — may be facilitated by seeing one or more of the following: i) More of a monomorphic upright QRS in lead V1 (which lacks the neatly defined, triphasic rsR' with taller right "rabbit ear" seen with typical RBBB); ii) Lack of a wide terminal S wave in lateral chest lead V6; iii) Seeing an all-positive (or at least predominantly positive) widened QRS in leads I and/or aVL, with no more than a tiny, narrow s wave in these leads; and/or, iv) Seeing widened, all-negative (or almost all-negative) QRS complexes in the inferior leads.

What About Today's ECGs?
Although details of the history of today's patient are lacking — the patient is elderly — he has had "an irregular heart beat for years" — and his initial ECG on EMS arrival ( = ECG #1) clearly suggests advanced conduction system disease with a potentially lethal rhythm were it not for spontaneous conversion to the tracing shown in ECG #2.
  • In this clinical context — findings in ECG #2 are clearly consistent with masquerading BBB. 

  • A permanent pacemaker is needed. 


==================================
Acknowledgment: My appreciation to Max-Gordon-Hall (from Batlow, New South Wales, Australia) for the case and this tracing.
==================================

Related ECG Blog Posts to Today’s Case:

  • ECG Blog #205 — Reviews my Systematic Approach to 12-lead ECG Interpretation. 

  • ECG Blog #282 — reviews a user-friendly approach to the ECG diagnosis of the Bundle Branch Blocks (RBBB, LBBB and IVCD).

  • ECG Blog #203 — reviews ECG diagnosis of Axis, Hemiblocks and Bifascicular Blocks.

  • ECG Blog #394 — reviews another case of Masquerading BBB.


=======================

ADDENDUM #1 (3/6/2024): 

=======================
In follow-up to the Comment I have just received from H.S.Cho — I would expand on my description of the cardiac rhythm in ECG #1 from today's case.
  • Given the history in today's case (ie, Sudden onset of the rhythm seen in ECG #1 — that within a minute spontaneously resolved) — Rather than "near ventricular standstill" — this rhythm is best described as PD-PAVB (Pause-Dependent Paroxysmal AtrioVentricular Block).

  • For clarity — I have reproduced Figure-1 from today's case.

Figure-1: The 2 ECGs in today's case. 


Paroxysmal AtrioVentricular Block (PAVB):
As described by Bansal et al (J Arrhythmia 35:870-872, 2019) — Bosah et al (Cureus 14[7]: e27092, 2022) — and Uhm et al (Heart Rhythm Case Rep 4(5):197-199, 2018) — the entity known as PAVB is a potential cause of syncope that is easily overlooked and which is potentially lethal (probably more often than is commonly realized).
  • PAVB is characterized by the sudden, unexpected onset of complete AV block with delayed ventricular escape — therefore resulting in a prolonged period without any QRS on ECG. Prior to the prolonged pause — the patient manifests 1:1 AV conduction without other evidence of AV block (which is why onset of PAVB is typically so unsuspected!).
  • Because of its totally unexpected onset and propensity to result in sudden death — PAVB is difficult to document and significantly underdiagnosed.
  • Three mechanisms for producing PAVB have been described: i) Vagally mediated (ie, Vagotonic Block — as described in ECG Blog #61, with the references listed at the end this Blog post citing instances of transient asystole from excessive vagal tone!); ii) Intrinsic (Phase 4 = pause- or bradycardic-dependent) PAVB; — and, iii) Idiopathic.

i) Vagotonic AV Block:
This form of PAVB is potentially benign when it results from a transient profound surge of parasympathetic tone in an otherwise healthy individual (as might occur with an episode of severe vomiting; a fit of severe coughing; vasovagal reaction from a blood draw).
  • The problem with vagotonic PAVB is localized to within the AV Node.
  • There will often be a "prodome" of diaphoresis, nausea, dizziness — with the patient aware of imminent fainting.

  • Characteristic ECG findings of vagotonic PAVB include progressive sinus rate slowing — often associated with an increasing PR interval and a narrow-QRS escape focus — followed by recovery with progressive return to a normal sinus rate and normal PR interval.

ii) Intrinsic PAVB:
Several names have been attached to this mechanism of PAVB — including most commonly "Phase 4 AV block" and/or PD-PAVB (Pause-Dependent Paroxysmal AtrioVentricular Block).
  • PD-PAVB is the most likely mechanism for the cardiac rhythm in ECG #1 from today's case. The underlying pathology is severe His-Purkinje System disease (strongly suggested by the presence of MBBB in ECG #2 of today's case). This form of PD-PAVB is likely to be fatal unless the patient receives a permanent pacemaker.
  • The interesting pathophysiology of PD-PAVB results from chance occurrence of an "appropriately-timed" PAC or PVC that partially depolarizes the diseased HPS (His-Purkinje System) at a specific point in the cycle that renders the poorly-functioning HPS unable to complete depolarization. The resultant prolonged pause in ventricular depolarization may only resolve if another "appropriately-timed" PAC or PVC occurs at the precise point needed to "reset" the HPS depolarization cycle (which presumably explains why the patient in today's case spontaneously recovered).
  • Of note — although severe underlying HPS disease is evident from the MBBB seen in ECG #1 of today's case — up to 1/3 of patients with PD-PAVB do not show evidence of conduction defects on ECG, thereby complicating documentation of this diagnosis.

  • PEARL #4: In addition to seeing MBBB in ECG #2 — the fact that the atrial rate remains the same in both ECG #1 and ECG #2 is yet one more reason why the rhythm in ECG #1 does not represent simple vagotonic PAVB.

iii) Idiopathic PAVB: 
This is the most recently described form of PAVB — in which findings are not consistent with either of the other 2 forms.
  • The baseline ECG before idiopathic PAVB tends to be normal.
  • No "trigger" for PAVB is evident (ie, no source of excessive vagal tone — and no precipitating PACs/PVCs are seen).

=====================================

NOTE: The conduction disturbance shown in ECG #1 from today's case differs from that shown in ECG Blog #342 — in which the initial rhythm was AFib (ie, no P waves present for the first 6 beats in this tracing) — followed by a prolonged flat line pause (nearly 5 seconds in duration) — until finally a QRS complex preceded by a P wave (that may or may not have been conducting) was seen.
  • Whether the prolonged flat line pause in this Blog #342 example represents another variation of PD-PAVB due to severe underlying disease of the His-Purkinje System — or reflects severe SA Node disease (ie, Sick Sinus Syndrome) — or most likely represents some combination of the two, is uncertain from the single ECG I was provided with.
  • That said — the BOTTOM Line remains the same, namely that assuming nothing "fixable" is found — permanent pacing will be needed.


=======================

ADDENDUM #2 (9/1/2025): 

=======================
My credit to WB Ren for his comment in the EKG Club that has made me rethink about the fascinating electrophysiology of the heart's conduction system.
  • WB Ren's comment relates to the phenomenon of changing P wave morphology, that rather than being due to a wandering atrial pacemaker shift in the atrial site of impulse formation — may at times result from a phenomenon similar to that seen in today's case (ie, instead of a diseased AV node or Purkinje conduction system — the problem may be Phase-4 Block in some but not all portions of the SA node — thereby resulting in an intermittent change in P wave morphology).
  • For the basics of Phase-4 Block (Bradycardia-dependent Block) — I found this explanation in the on-line ECGbook enlightening.
  • Additional examples and explanation of Phase-4 Purkinje System Block can be found in the Ulm et al manuscript HeartRhythm Case Rep 4(5):197-199, 2018.

  • With the concepts illustrated by my above link to the on-line ECG book — I found the stepwise AI explanation of the physiology of Phase-4 Block much more understandable than it previously had been to me. I've therefore copied below this AI explanation.
====================================