Friday, April 14, 2023

ECG Blog #374 — Do You Know the "Culprit"?


The ECG in Figure-1 was obtained from a 90-year old woman — who presented with a 2-to-3 day history of chest pain, that became worse on the day of admission.
  • How would YOU interpret the ECG in Figure-1?
  • Is there acute coronary occlusion? If so — What is the "culprit" artery?
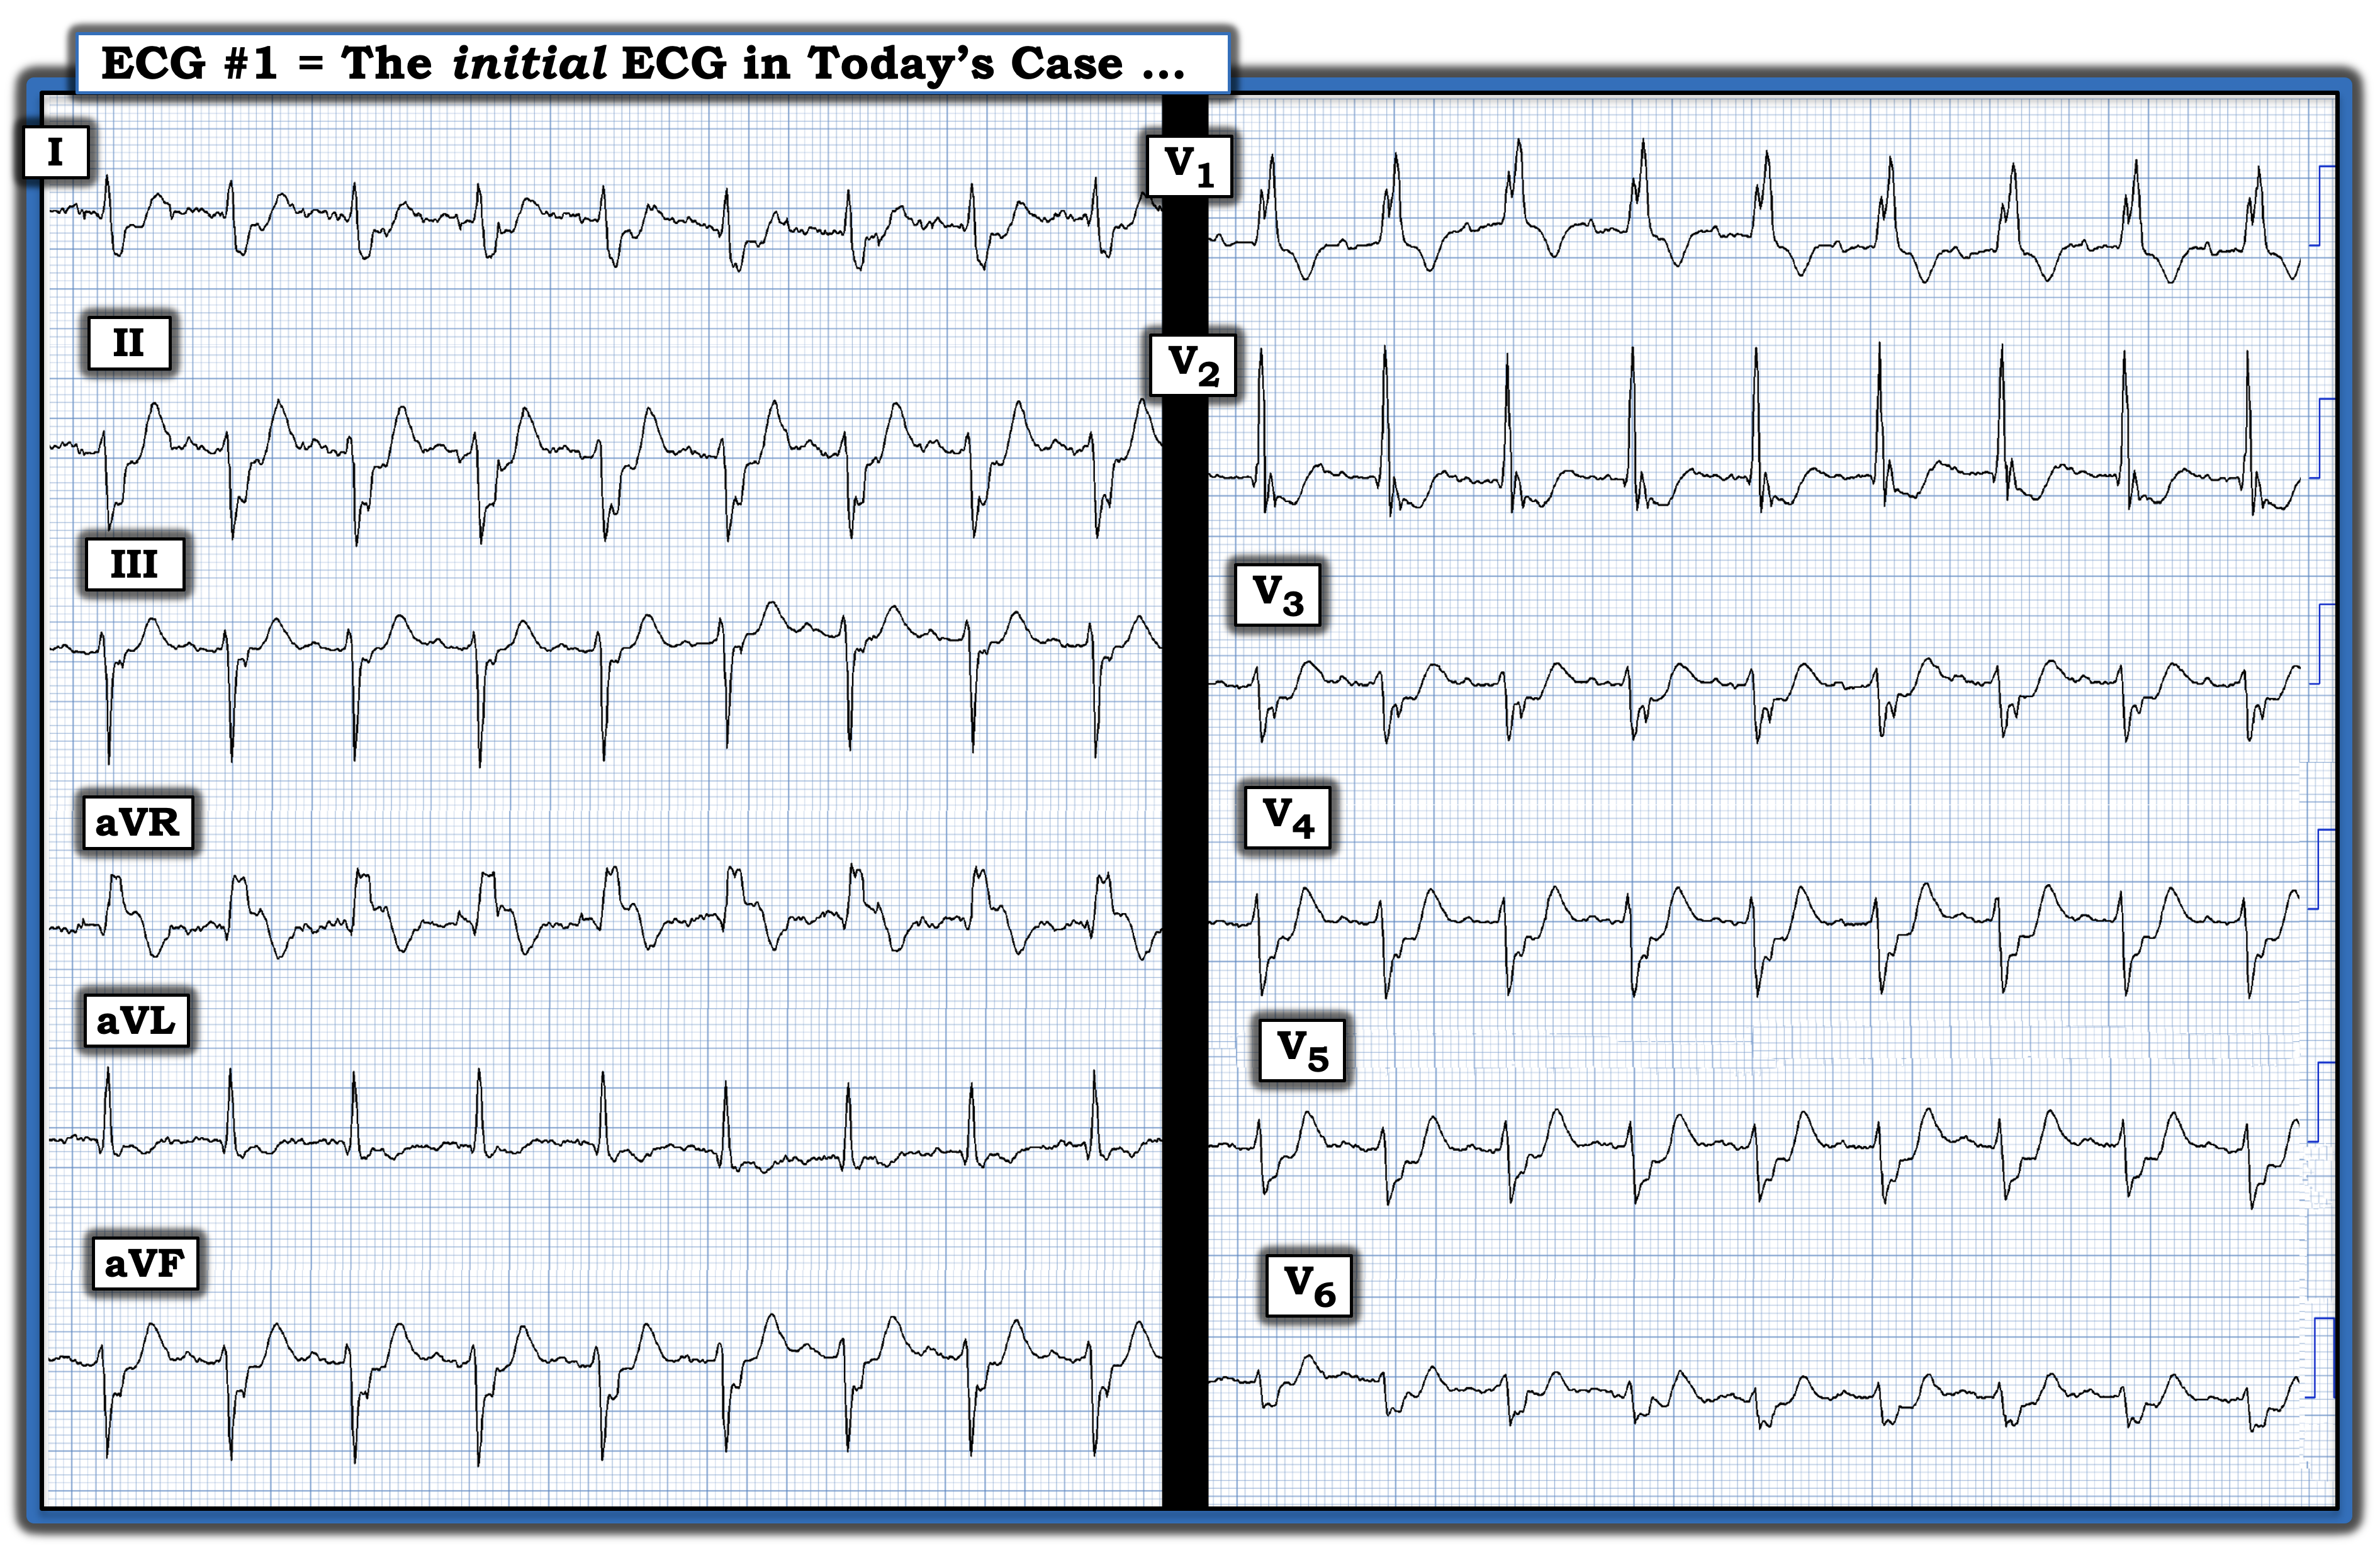
Figure-1: The ECG in today’s case. (To improve visualization — I've digitized the original ECG using PMcardio).


MY Thoughts on the ECG in Figure-1:
There is significant baseline artifact in a number of leads in ECG #1. That said — the rhythm is sinus, at a rate just under 100/minute. The PR interval is normal — but the QRS is wide:
  • The reason for QRS widening is bifascicular block: i) The all upright and notched R wave in lead V1 — in association with wide terminal S waves in lateral leads I and V6 is consistent with RBBB (Right Bundle Branch Block); and, ii) Predominant negativity in each of the inferior leads is consistent with LAHB (Left Anterior HemiBlock).

  • A small q wave is seen in lead aVL. A tiny initial negative deflection (q wave) is also seen in lead V2. I suspect these small q waves are not clinically significant.
  • What is clinically significant, especially in view of new chest pain over the past 2-3 days that this patient reports — are the significant ST-T wave deviations in multiple leads (Figure-2).

Figure-2: I've labeled today's ECG to highlight ischemic findings. The vertical RED lines mark the end of the QRS complex in each of the 12 leads — and the "Ts" highlight hyperacute T waves. (See text).


Looking Closer at Today's ECG:
The most challenging part of assessing ST-T wave deviations in today's tracing — is distinguishing between the end of the QRS complex — and — the beginning of the ST-T wave. To facilitate this distinction — I've added vertical RED lines to mark the end of QRS complex in each of the 12 leads.
  • NOTE: Although the end of the QRS is not well seen in many of the leads in today's tracing — it is clearly delineated in leads II and aVR in the limb leads — and especially in lead V1 in the chest leads.
  • To facilitate assessment of ST depression and/or elevation — I focused my attention on the relative position of the J-point (located just to the right of the vertical RED line) in each of the 12 leads — with respect to the short dotted RED lines that mark the ST segment baseline in each lead.

ST-T Wave Abnormalities in Figure-2:
  • ST depression is most marked in the chest leads (clearly beginning in Lead V2 — and extending through to lead V6).
  • The J-point also appears to be depressed in lead V1 — though this J-point depression with T wave inversion that we see in lead V1 is not necessarily abnormal given the RBBB.
  • ST depression is also marked in lead I — and seen (albeit to a lesser extent) in limb leads II, aVL and aVF.

  • ST elevation is marked in lead aVR. It is not seen in other leads.

  • Hyperacute T waves (ie, being taller, "fatter"-at-their-peak and wider-at-their-base than expected given QRS amplitude in each respective lead) — are seen in multiple leads (ie, in leads II,III,aVF; and in leads V3-thru-V6 — as suggested by the "Ts" in these leads).

Putting It All Together: 
In view of the 2-3 day history of chest pain, that became worse at the time the ECG in Figure-2 was recorded — My thoughts were the following:
  • The relatively rapid sinus heart rate (just under 100/minute) is potentially worrisome — since sinus tachycardia is usually not seen with acute MI unless there is hemodynamic compromise.
  • There is bifascicular block (ie, RBBB/LAHB) — with fragmentation of the QRS complex. These 2 findings strongly suggest significant underlying heart disease in this 90-year old patient — although without a prior tracing for comparison, we can not tell what is "new" vs "old".

  • There is marked and diffuse ST depression in multiple leads (with ST elevation in lead aVR). This ECG pattern suggests coronary disease that may be acute — but which does not localize to any particular anatomic lead area. The underlying pathophysiologic process responsible for this ECG pattern is "supply-demand mismatch". The terminology favored to describe these ECG findings is diffuse subendocardial ischemia (See ECG Blog #271 — for more on diffuse subendocardial ischemia).

  • In addition to diffuse ST depression — there are hyperacute-looking T waves in multiple leads (that I've labeled with a Ts in Figure-2). This pattern of J-point ST depression rising to hyperacute-looking T waves in multiple chest leads in a patient with new chest pain — suggests deWinter-like T waves as a result of ongoing LAD (Left Anterior Descending) occlusion (See ECG Blog #183 — for more on deWinter T Waves).

  • NOTE: As stated a moment ago — without a prior tracing, we don't know if the RBBB/LAHB is "new" or "old". That said — this combination of conduction defects is very commonly seen with acute proximal LAD OMI (Occlusion-based MI).

  • BOTTOM Line: Looking at this single tracing — I wasn't sure about what the acute lesion might be, or when it may have happened. The patient's symptoms had been ongoing for "2-3 days" — and at 90 years of age with significant QRS fragmentation of her bifascicular conduction defect — much of what we see may have happened in the past. Other than lead aVR — there is no ST elevation in Figure-2. That said — the important point is her ongoing (and increasing) chest pain. Pending more data (ie, repeat ECG; troponins, Echo, etc.) — an extensive acute ongoing event must be assumed until proven otherwise.


CASE Follow-Up:
The patient's chest pain was controlled. Initial troponin was only minimally elevated. Echo revealed a localized apical wall motion abnormality. 
  • Cardiac Cath — revealed a 90-99% LMain (Left Main) — and — a 90-99% proximal LAD narrowing. There was no significant disease in the LCx or RCA. 

  • PCI was successful — and this 90-year old patient did surprisingly well!
  • Subsequent troponin values rose markedly — with a peak value = 77000.


Acute LMain Disease:
Emergency providers rarely encounter patients with acute LMain occlusion. The reason for this is simple — Most such patients die quickly, usually before they reach the hospital.
  • There is no “single” ECG presentation for patients with acute LMain occlusion. Quite literally — You can see almost anything!
  • As shown in Figure-3 — the reason for the highly variable ECG presentation with LMain occlusion — is that multiple territories may be involved to varying degrees — making it impossible to predict how much ST elevation you will see — and how much opposing (reciprocal) ST depression will attenuate (if not completely cancel out) these initial ST segment vector forces.
  • The ST-T wave appearance in lead aVR can be anything when there is acute LMain occlusion.

  • To Emphasize: We don't know for certain whether the LMain or the proximal LAD was the "culprit" vessel in today's case — as the patient's symptoms were ongoing for several days, and neither vessel was 100% occluded at the time of cath. It's almost certain there was at least some spontaneous reperfusion of one or both vessels. What was certain in today's case — was the need for prompt cath and PCI, that fortunately was accomplished.


Figure-3 (I updated this Figure on 5/11/2026 — so as to include additional data): Reasons for the varied ECG presentation of acute LMain occlusion — with this summary synthesized from Dr. Smith’s 8/9/2019 post in his ECG Blog. I discussed the findings of acute LMain occlusion further in My Comment in the January 16, 2020 post of Dr. Smith's ECG Blog — and I have now updated this Figure from my December 18, 2025 post of Dr. Smith's ECG Blog.


==========================================

Acknowledgment: My appreciation to Magnus Nossen (from Fredrikstad, Norway) for the case and this tracing.

==========================================


==================================

Related ECG Blog Posts to Today’s Case:

  • ECG Blog #205 — Reviews my Systematic Approach to 12-lead ECG Interpretation.
  • ECG Blog #185 — Review of the Ps, Qs, 3R Approach for systematic rhythm interpretation.

  • ECG Blog #271 — Reviews the concept of diffuse subendocardial ischemia.

  • ECG Blog #316 — The patient died. Was the LMain coronary artery the "culprit"?

Additional Relevant ECG Blog Posts

  • ECG Blog #193 — Reviews a case with a dominant LCx as the "culprit" artery (with ECG AUDIO Pearl on the concept of "OMI" and on Predicting the "Culprit" Artery).

  • ECG Blog #184 — That magical inverse relationship between leads III and aVL.
  • ECG Blog #167 — More on that "magical" lead III-aVL relationship.
  • ECG Blog #183 — deWinter-like T waves.

  • ECG Blog #56 — Posterior MI; Mirror Test.
  • ECG Blog #80 — What’s the Culprit Artery? + the Mirror Test
  • ECG Blog #82 — What’s the Culprit Artery?
  • ECG Blog #162 — What’s the Culprit Artery?
  • ECG Blog #193 — What's the Culprit Artery?
  • ECG Blog #222 — What's the Culprit Artery? 


Sunday, April 9, 2023

ECG Blog #373 — 86yo and this Rhythm ...


The 12-lead ECG and long lead II rhythm strip in Figure-1 was obtained from an 86-year old man — who presented to the ED (Emergency Department) with presyncope. No chest pain. The patient was hemodynamically stable in association with this rhythm.
  • How would YOU interpret the ECG in Figure-1?
  • What is the rhythm?

Figure-1: The initial ECG in today's case — obtained from an 86-year old man with presyncope, but no chest pain. (To improve visualization — I've digitized the original ECG using PMcardio).


MY Thoughts on the ECG in Figure-1:
The overall rate of the rhythm in Figure-1 is not fast. Knowing that this patient is hemodynamically stable provides us with some time to carefully consider the etiology of the rhythm before turning our attention to findings on the 12-lead ECG.
  • PEARL #1: When your patient is stable in a rhythm that is not overly fast — I favor starting with assessment of the long lead rhythm strip before going into detail about findings on the 12-lead ECG. As will soon become apparent — the reason for this is that knowing which beats are ventricular vs supraventricular will be critical for assessing the likelihood of acute ST-T wave changes.


The Long Lead II Rhythm Strip:
As always — I favor a systematic approach to rhythm interpretation, using the Ps, Qs, 3R memory aid (See ECG Blog #185).
  • Regarding QRS width — there are 2 different QRS shapes in the long lead II rhythm strip in Figure-1: i) Beats #1,2,3,4; and beats #8,9,10 are wide; and, ii) The remaining QRS complexes are narrower.
  • P waves are present in today’s tracing! In Figure-2 — I’ve highlighted with RED arrows those P waves that I can be certain about. 
  • Note that each of the 4 RED arrows in Figure-2 — appear with a constant (and normal) PR interval before narrow-QRS complex beats that manifest a similar morphology. This tells us that there is an underlying sinus rhythm in today's tracing, here with a heart rate of ~70/minute (ie, the R-R interval between beats #5-6; 6-7; and between beats #11-12; and #12-13 — is just over 4 large boxes in duration, which corresponds to a rate of ~70/minute).


Are there Additional P Waves?
  • The easiest way to find out if there are additional P waves in Figure-2 — is to use calipers. Setting your calipers to the P-P interval defined by 2 consecutive P waves about which I am certain (ie, I set my calipers to the P-P interval between beats #6-7) — it can be seen that the “next walk” of the calipers using this P-P interval will fall right on the PINK arrow in Figure-2.

  • PEARL #2: Identifying additional atrial activity is the KEY to interpreting today’s rhythm. Note that the very small initial triangular deflection under the PINK arrow in Figure-2 — is wider than the small initial r wave in front of all other beats in this tracing. This confirms that after the first 2 RED arrows in Figure-2 — the next on-time sinus P wave lies directly under the PINK arrow.

  • PEARL #3: The fact that the PR interval that begins from the PINK arrow (and extends until the QRS of beat #8) is too short to conduct — indicates that at least for this beat, there is AV dissociation (because this PINK arrow P wave is not Related to its neighboring QRS). This very short PR interval means that "something else" must have occurred before the PINK P wave has a chance to conduct — which confirms that the wide and different-looking beat #8 must be a ventricular beat!


PEARL #4: Is Beat #8 a PVC or an “Escape” Beat?
It is important to clarify distinction between a "PVC" vs an "escape" beat. By definition — a PVC is “Premature" (ie, occurs earlier-than-expected). In contrast — an "escape" beat occurs later in the cycle. 
  • Instead of occurring “early” — beat #8 in Figure-2 occurs relatively late in the cycle. As a result — beat #8 is best classified as a ventricular "escape" beat.

  • Since beats #1-thru-4; and #9,10 all look the same in QRS morphology as beat #8 — these are all ventricular beats. And since each of these ventricular beats is separated by a similar R-R interval (that is ~4 large boxes in duration) — these beats constitute 2 short runs of AIVR (Accelerated IdioVentricular Rhythm) at a rate of ~75/minute.

  • NOTE: As discussed in detail in ECG Blog #108 — "AIVR" is an "enhanced" ventricular ectopic rhythm that occurs faster than the intrinsic ventricular escape rate (which is typically between 20-40/minute) — but slower than hemodynamically significant Ventricular Tachycardia (ie, VT at rates >130-140/minute).


Putting It All Together:
To emphasize — It should take you no more than seconds to complete the above rhythm analysis steps. These steps strongly suggest the following regarding the rhythm in Figure-2:
  • That there is an underlying sinus rhythm at ~70/minute.
  • This underlying sinus rhythm is interrupted by short runs of AIVR that occur at a slightly faster rate (ie, of ~75/minute).

Figure-2: I've highlighted with RED arrows the 4 P waves in today's rhythm that I can be certain about.


Remaining Questions about Today's CASE:
A few questions remain regarding the ECG in today's case:
  • Are there more "hidden" P waves?
  • What is the etiology of beats #5 and #11 in Figure-2?
  • Is the overall rhythm in today's case related to the presyncopal episode that prompted this 86-year old man to present to the ED?

What about Beats #5 and #11?
For clarity — I show only the long lead II rhythm strip in Figure-3. Note that I have now added 3 additional PINK arrows (ie, over the small "hump" that appears just after the QRS of ventricular beat #9 — and at the peak of the T waves that precede beats #5 and 11).
  • Isn't it logical to propose that the PINK arrow I have added just after the QRS of beat #9 must represent another on-time sinus P wave?
  • And — Aren't the T waves that precede beats #5 and #11 in Figure-3 ever-so-slightly taller than T waves of the other ventricular beats in this tracing?
  • Isn't it logical to therefore propose that the PINK arrows I have added before beats #5 and #11 — are likely to represent additional on-time sinus P waves that are conducted to the ventricles (albeit with a slightly prolonged PR interval) to produce beats #5 and #11?

Figure-3: For clarity — I focus on the long lead II rhythm strip. Note that I've added 3 additional PINK arrows since Figure-2 (ie, over the small "hump" that appears just after the QRS of ventricular beat #9 — and at the peak of the T waves that precede beats #5 and #11).


What is the Clinical Significance of AIVR in this Case?
As discussed in ECG Blog #108 — AIVR generally occurs in one of the following Clinical Settings: i) As a rhythm during cardiac arrest; ii) In the monitoring phase of acute MI (especially with inferior MI); or, iii) As a reperfusion arrhythmia (ie, following thrombolysis, acute angioplasty, or spontaneous reperfusion). It may also occur in patients with underlying coronary disease, cardiomyopathy, and/or with digoxin toxicity. 
  • On rare occasions — AIVR may occur intermittently in otherwise healthy subjects without underlying heart disease. If such subjects are asymptomatic during episodes — then no treatment is needed.

  • Regarding Today's CASE: The patient is elderly (86 years old) — and he presented following a presyncopal episode. The patient may have SSS (Sick Sinus Syndrome) as the reason for presyncope. The other main consideration — is to take another look at the 12-lead ECG, and assess this for recent ischemia or infarction.
  • Assessment for QRST morphology is best accomplished by looking at sinus-conducted beats — since Q waves and ST-T wave changes are often difficult to evaluate for ventricular beats. To facilitate this assessment in Figure-4 — I've enclosed within dotted RED rectangles the QRST complexes to be evaluated within various leads on the 12-lead tracing for sinus-conducted beats #5,6,7; and #11,12,13. These suggest that there is some QRS widening for these sinus-conducted beats (ie, a nonspecific IVCD), with some nonspecific ST-T wave flattening — but nothing that looks acute.

Figure-4: Taking another look at the 12-lead tracing in today's case. I've enclosed within dotted RED rectangles — the QRST complexes to be evaluated within various leads on the 12-lead tracing for sinus-conducted beats #5,6,7; and #11,12,13 (See text).


========================================

LADDERGRAM Illustration:
Clarification of the mechanism in today's arrhythmia is best explained by laddergram illustration (Figure-5).
  • As I have often emphasized — it takes a little time to get good at drawing laddergrams (See ECG Blog #188). In contrast — It is not difficult to learn how to read laddergrams!

  • In Figure-5 — Regular sinus P waves are seen conducting in the Atrial Tier, except for the first 4 beats for which I don't see evidence of atrial activity.
  • The wider beats in Figure-5 that are not preceded by P waves  are ventricular. In the laddergram — these beats originate from the Ventricular Tier — and conduct to some degree beyond the AV node. These ventricular beats constitute 2 short runs of AIVR (ie, beats #1,2,3,4; and #8,9,10).
  • Retrograde conduction from ventricular beats #8 and 9 prevents forward conduction of the on-time sinus P waves that are seen just before the onset of beat #8 — and just after the QRS of beat #9.
  • Retrograde conduction from ventricular beats #4 and #10 results in "concealed" conduction — and slows forward conduction of the next on-time sinus P waves that are hidden within the T waves of beats #4 and #10 (dotted RED lines seen within the AV Nodal Tier).
  • Beats #6,7; and 12,13 — are normally conducted sinus beats.
  • Presumably — the run of AIVR from beats #1-thru-4 inhibited the SA node from firing during this period.


Figure-5: Laddergram illustration of today's arrhythmia.


==================================

Acknowledgment: My appreciation an anonymous clinician for the case and these tracings.

==================================


Relevant ECG Posts to Today's Case:

  • ECG Blog #185 — Reviews the Ps, Qs & 3Rs Approach to systematic rhythm interpretation.
  • ECG Blog #210 — Reviews the every-other-beat Method for estimating the rate of regular rapid rhythms.

  • ECG Blog #188 — Reviews the essentials for reading (and/or drawing) Laddergrams, with LINKS to numerous Laddergrams I’ve drawn and discussed in detail in other blog posts.

  • ECG Blog #108 — Reviews the concept of AIVR.
  • Riera ARP, et al: AIVR: Chronology and Main Discoveries: Indian Pacing and EP Journal 10: 40-48, 2010.

  • ECG Blog #68 — Reviews the concept of "concealed" conduction.


Monday, April 3, 2023

ECG Blog #372 — PVCs or Aberrant?


I was asked for my interpretation of this tracing. No history was provided.
  • How would YOU interpret this long lead II rhythm strip?
  • Are the different-looking beats PVCs or supraventricular impulses conducted with aberration? — or — Something else?

Figure-1: The long lead II rhythm strip for today’s case. No history was available. (To improve visualization — I've digitized the original ECG using PMcardio).


MY Thoughts on the Rhythm in Figure-1:
Although no history is provided for today's case — I'll presume the patient is hemodynamically stable with the rhythm in Figure-1, since runs of the wide beats are not sustained. As always — I favor a systematic approach to rhythm interpretation, using the Ps, Qs, 3R memory aid (See ECG Blog #185).
  • PEARL #1: When 2 or more “elements” exist for a given arrhythmia — I find it easiest to start with the easiest element to interpret. In most cases — this entails looking for the underlying rhythm. The 2 elements in today’s rhythm are distinguished by the 2 different QRS morphologies: i) Element #1 (a total of 10 beats) = Beats #2-thru-5; #9,10; #14-thru-17; and, ii) Element #2 (7 beats) = Beats #1; 6,7,8; and 11,12,13 — which are wider and clearly different in appearance than the beats for Element #1.


Focusing first on the 10 beats in Element #1:
  • The QRS complex looks narrow in this single monitoring lead.
  • P waves are present in front of each of the Element #1 beats, with the possible exception of beat #9 (for which it is difficult to know at first glance whether or not a P wave is hidden in the preceding T wave). In Figure-2 — I’ve labeled all P waves in today’s rhythm that I am certain about. Note that each of these P waves is upright in this lead II, with a constant and normal PR interval. Therefore — there is an underlying sinus rhythm.

  • Focusing on the simplest “segment” in today’s rhythm ( = beats #2-thru-5) — the QRS looks to be narrow in this single monitoring lead — sinus P waves with a constant and normal PR interval precede each QRS — and the rhythm is regular at a rate slightly faster than 100/minute.

Figure-2: I've labeled all P waves that I was certain about in Figure-1 — with RED arrows.


QUESTION:
  • Are there some additional P waves in Figure-2 that are not labeled because they are partially (or completely) hidden within QRS complexes or ST-T waves?

  • HINT: How might using calipers help to easily answer this question?


ANSWER:
  • LOOK at Figure-3 . . . 

Figure-3: I’ve added PINK arrows to indicate where P waves were “hiding”.


PEARL #2:
Whenever you are confronted by a complex arrhythmia, and you have the “luxury” of a moment of time (because the patient is hemodynamically stable) — using calipers is by far the most time-efficient way to facilitate your interpretation:
  • Simply set your calipers to a P-P interval determined by the distance between any 2 consecutive P waves of similar morphology that you clearly see. In Figure-3 — you can choose the P-P interval between beats #2-3 — or between  #3-4; between #4-5 — or near the end of the rhythm strip, the P-P interval between beats #14-15; 15-16; or 16-17.
  • Once you’ve set your calipers to any one of the above P-P intervals — See if you can “walk out” an underlying regular atrial rhythm. The PINK and RED arrows in Figure-3 — show that you can! Note that either a definite P wave — or — some “extra” deflection (in either the QRS or ST-T wave) — can be seen under each of the colored arrows in today’s rhythm!

  • NOTE: P wave deflections in Figure-3 are not perfectly regular. Instead — there is slight variation in the P-P interval, consistent with some degree of sinus arrhythmia. Slight variation in the P-P interval as is seen here is not uncommon with complex arrhythmias.

  • To Emphasize: If you use calipers — it should not take you more than 10 seconds (at most!) — to establish that the underlying atrial rhythm in Figure-3 is essentially regular throughout the rhythm strip. Without using calipers — it will take much longer (and even, then you will not know for certain if there truly is an underlying sinus rhythm).


Putting Together What We Know at this Point:
Establishing that the underlying atrial rhythm is regular is KEY to interpreting today’s rhythm. Now that we know this — we can say the following:
  • The underlying rhythm in Figure-3 is sinus tachycardia at ~105/minute.
  • The QRS is narrow for each of the normal sinus-conducted beats (ie, for beats #2-thru-5; #10; and beats #14-thru-17).
  • Since the QRS of beat #9 looks identical to the QRS for all other sinus beats — beat #9 is also a supraventricular beat. Note that a PINK arrow precedes beat #9 in Figure-3 — indicating that an “on-time” sinus P wave is hiding within the T wave of beat #8. This tells us that beat #9 is a sinus-conducted beat, albeit with a slightly longer PR interval compared to the PR interval of all other sinus beats.


Now that we’ve established the diagnosis of Element #1 — I turned my attention to the 7 beats in Element #2 that are wider and look different than sinus-conducted beats (ie, beats #1; 6,7,8; and 11,12,13).
  • These beats — are dissociated from (and completely unrelated to) neighboring sinus beats. We know this — because the PR intervals that occur just before the on-time sinus P waves that deform the initial part of the QRS of beats #6 and 11 are too short to conduct! This proves that each of the beats that look like beats #6 and 11 must be PVCs (Premature Ventricular Contractions). 

  • For review of how recognizing AV dissociation proves the presence of PVCs — See ECG Blog #133.


BOTTOM Line: Simply stated — today’s rhythm represents an underlying sinus tachycardia (at ~105/minute) — with frequent PVCs, including 2 salvos of 3 PVCs in a row ( = beats #6-8 and 11-13).
  • To Emphasize: Although my above step-by-step description is written in “slow motion” — In "real time", it should take no more than seconds to arrive at this conclusion using the above approach.


======================================

What Does the 12-Lead ECG Show?
I was then shown the 12-lead ECG corresponding to the rhythm strip that we have been assessing (Figure-4).
  • What do we learn from seeing the 12-lead ECG?

Figure-4: The 12-lead ECG that corresponds to the rhythm we have been assessing. (To improve visualization — I've digitized the original ECG using PMcardio).


On Seeing the 12-Lead ECG:
Whenever possible in my interpretation of a complex arrhythmia — I favor obtaining a 12-lead tracing. Doing so may prove invaluable by: i) Confirming your theory about the presence and nature of atrial activity; ii) Confirming whether the QRS is truly wide or narrow; and/or, iii) Sometimes providing indication of the cause of the arrhythmia (ie, hyper- or hypokalemia; acute infarction; etc.). In Figure-4 — We learn the following from seeing the simultaneously-recorded 12-lead tracing:
  • There is no longer any doubt that beats #1; 6,7,8; and 11,12,13 are PVCs! Each of these beats is obviously wide and totally different in morphology than the underlying sinus beats.

  • PEARL #3: ST-T wave morphology is best assessed in sinus-conducted beats. This suggests that the cause of the PVCs in today's rhythm is probably a recent infarction.  ST-T wave changes are nonspecific for sinus beats #2,3,4 (in leads I,II,III) and for sinus beats #5 and 9 (in leads aVR,aVL,aVF) — but there is loss of R wave in lead V2 with some ST elevation in leads V2,V3 for sinus beat #10 — and ST coving with T wave inversion in leads V4,V5 for sinus beats #14-17.

======================================

LADDERGRAM Illustration:
Clarification of the mechanism in today's arrhythmia is best explained by laddergram (Figure-5).
  • As I have often emphasized — it takes a little time to get good at drawing laddergrams (See ECG Blog #188) — but it is not difficult to learn how to read them!

  • In Figure-5 — Regular sinus P waves are seen conducting in the Atrial Tier.
  • The normally conducted sinus beats are conducted through to the ventricles ( = beats #2,3,4,5; beat #10; and beats #14,15,16,17).
  • Beats #1, 6,7,8; and 11,12,13 are PVCs. These beats originate from the ventricles, and conduct to some degree beyond the AV node — thereby preventing forward conduction of the on-time PINK sinus P waves, that fail to conduct to the ventricles.
  • One of the on-time sinus P waves in Figure-5 (YELLOW arrow) — is able to conduct to the ventricles, but with a longer-than-expected PR interval because it is partially delayed by backward conduction from the PVC before it ( = beat #8). 

  • PEARL #4: Although the PR interval of the on-time YELLOW P wave in Figure-5 is increased — this is not the result of AV block. Instead — it is the result of what is known as "concealed conduction" — in which retrograde conduction from the preceding PVC, while not enough to block forward conduction of the next sinus beat — is enough to slighty prolong the ensuing PR interval. The term "concealed" is used — because we cannot explain this effect on the ensuing PR interval from what is seen on the actual ECG — but instead must infer there is retrograde conduction from the PVC impeding forward conduction of the next on-time sinus impulse (More on concealed conduction in ECG Blog #68).

Figure-5: Laddergram illustration of today's arrhythmia.


==================================

Acknowledgment: My appreciation to Dayanand Khanolkar (from Mumbai, India) for the case and this tracing.

==================================


Related ECG Blog Posts to Today’s Case: 

  • ECG Blog #205 — Systematic Approach to 12-lead ECG Interpretation. 
  • ECG Blog #185 — Systematic Approach to Rhythm Interpretation.

  • Our approach for distinction between VT vs SVT with either aberrant conduction or preexisting BBB — See ECG Blog #42.
  • For review of the Ashman Phenomenon — See ECG Blog #70.
  • For review of AV Dissociation — See ECG Blog #133 and ECG Blog #335.
  • For review of Fusion Beats — See ECG Blog #128.