Monday, March 13, 2023

ECG Blog #368 — Why So Fast?


I start today’s case with the ECG shown in Figure-1 — obtained from a 30-something year old man, who presented with palpitations.
  • How would YOU interpret the ECG in Figure-1?
  • Treatment?
  • What is unusual about this arrhythmia?


=========================
NOTE: The ECG in Figure-1 has been recorded at the usual 25mm/second speed — but with the Cabrera format (Please see my Editorial Note near the top of the page in ECG Blog #365 for review of the basics of this recording system).
=========================
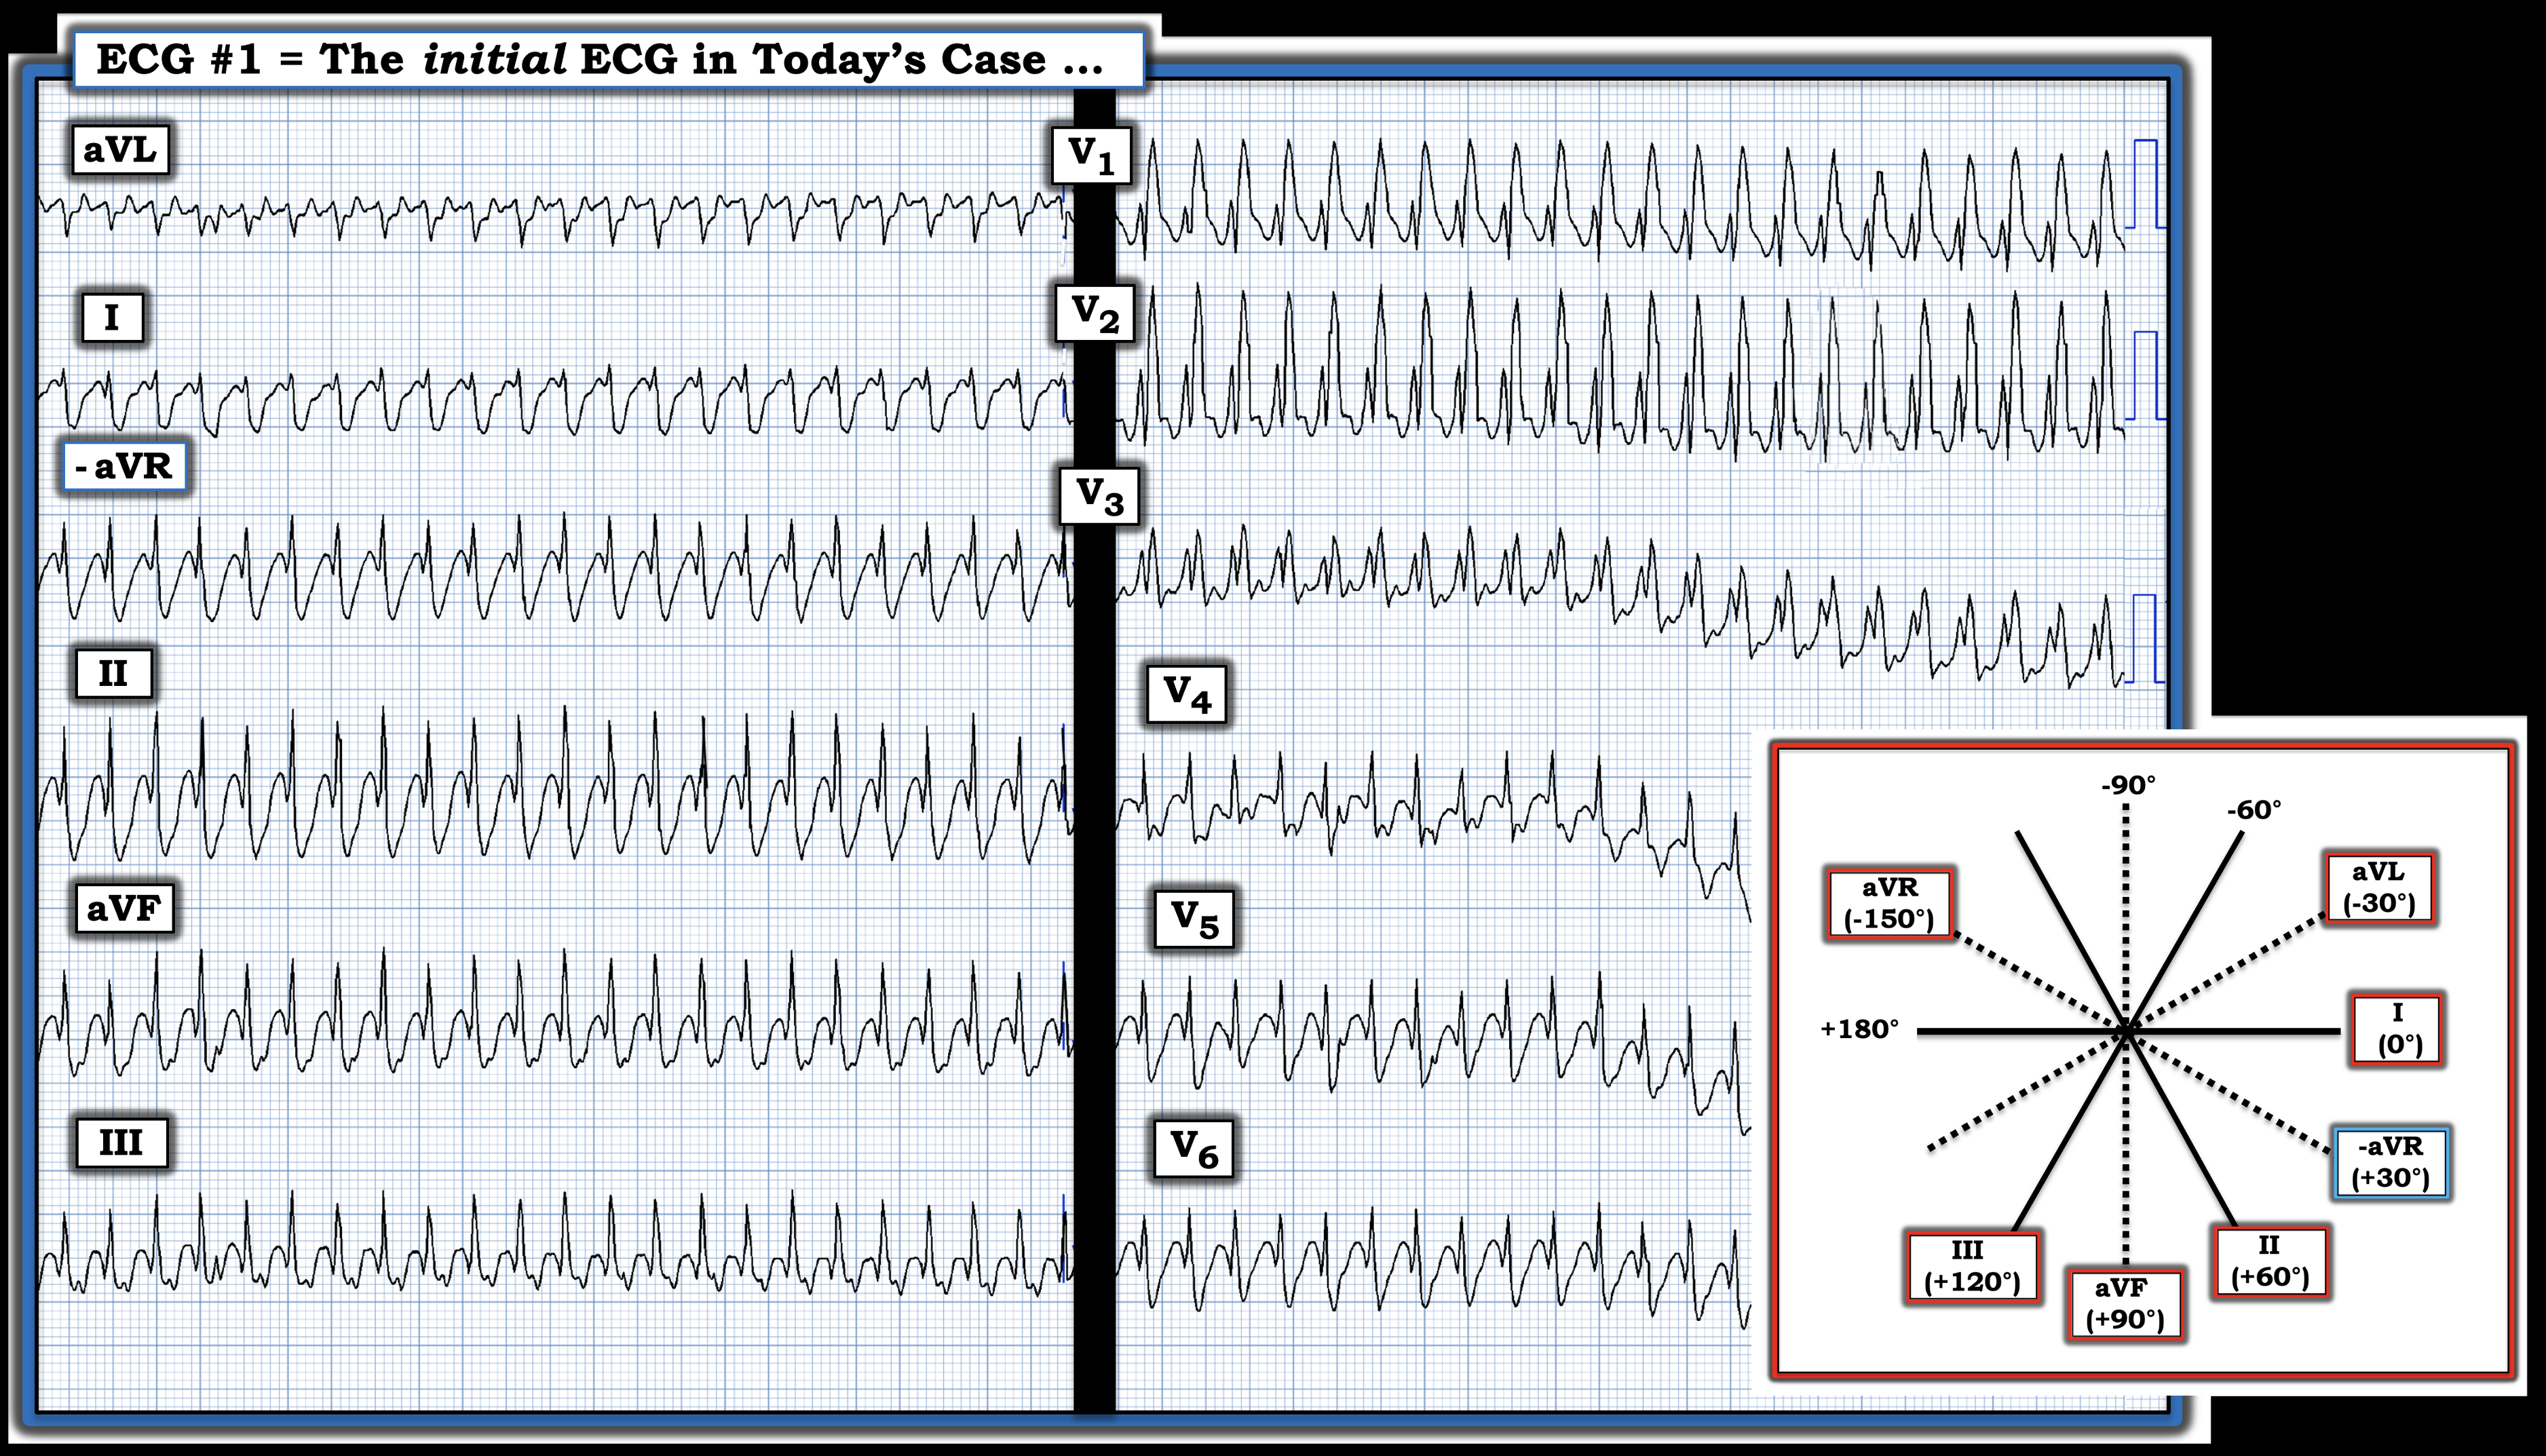
Figure-1: The initial ECG in today’s case. What is the rhythm? NOTE: This tracing was recorded at the standard 25 mm/sec. speed — but using the Cabrera format.  (To improve visualization — I've digitized the original ECG using PMcardio).


MY Thoughts on the ECG in Figure-1:
The rhythm in Figure-1 is regular and extremely rapid. QRS width is best assessed in leads V1,V2,V3 — which show a wide QRS (ie, ≥0.12 second in duration). Atrial activity is not seen.
  • Accurate estimation of the heart rate in Figure-1 provides an important clue to the etiology of today’s rhythm. To do this — I like to look for a part of the QRS complex (in this case — the peak of the R wave) that starts on a heavy line. Doing so suggests that the R-R interval of this exceedingly rapid arrhythmia is just a tiny amount over 1 large box — which corresponds to a ventricular rate just under 300/minute (ie, between 290-300/minute).
  • Morphology of the wide QRS in ECG #1 — is strongly suggestive of RBBB conduction because: i) There is a very typical triphasic (rSR’) complex in lead V1 — in which the initial r wave is slender — the S wave descends below the baseline — and there is a single, taller “right rabbit ear” (R’ deflection); and, ii) There are wide, terminal S waves in both of the key lateral leads ( = leads I and V6).


PEARL #1: An additional (less well known) feature of QRS morphology in today’s initial tracing that favors aberrant conduction — is the finding of the mirror-image opposite morphology for the QRS in lead I and/or lead V6 — compared to the rSR’ complex just described for lead V1. That is, in lead V6 of ECG #1 — we a qRS complex (ie, a definite initial Q wave — followed by a slender R wave — finishing in a wide, terminal S wave). 
  • While impossible to completely rule out fascicular VT —  the very typical rSR’ and qRS morphologies seen in leads V1 and V6, respectively — overwhelmingly suggests a supraventricular etiology for the rhythm in Figure-1.


PEARL #2: In association with the RBBB morphology suggested in leads V1 and V6 — QRS morphology in limb leads I, II and III is perfectly consistent with LPHB (Left Posterior HemiBlock) conduction (ie, predominant negativity of wide terminal S wave in lead I — with a qR pattern in leads II and III). 
  • This finding of completely typical QRS morphology for bifascicular block conduction (ie, RBBB/LPHB) — is yet one more feature of QRS morphology suggesting a supraventricular etiology (and not fascicular VT) for the rhythm in Figure-1.


Putting It All Together:  — The Rhythm in Figure-1
What we have just described is the following:
  • A regular WCT ( = Wide-Complex Tachycardia) at a rate very close to 300/minute — without clear sign of atrial activity.
  • QRS morphology that almost certainly indicates a supraventricular etiology.

Among the fast Supraventricular Rhythms:
  • This is not AFib — because the rhythm is regular.
  • It is also unlikely to be a reentry SVT rhythm (such as AVNRT or AVRT) — because these rhythms typically do not go this much faster than 240/minute.
  • VT is highly unlikely because QRS morphology (as per Pearls #1 and #2) is so consistent with a supraventricular etiology.

  • By the process of elimination — this leaves AFlutter with 1:1 AV conduction as the most likely etiology of the rhythm in Figure-1.


PEARL #3: Atrial Flutter with 1:1 AV conduction is rare! By far — the most common AV conduction ratio with untreated AFlutter is 2:1. Since the rate of atrial activity with flutter in adults is most often very close to 300/minute (ie, usual range for atrial activity ~250-350/minute) — AFlutter with 2:1 AV conduction typically results in a regular ventricular rate of ~140-160/minute.
  • The reason 1:1 AV conduction with AFlutter is rare — is the "built-in" refractory period of the AV node, which serves to "protect" the patient from attaining excessively fast ventricular rates (ie, over 250/minute) that may be hemodynamically compromising because they do not allow adequate time for ventricular filling.
  • Therefore — IF ever you see AFlutter with an excessively rapid ventricular rate (ie, over 250/minute) — LOOK for a reason WHY this may be so. The most common reason for 1:1 AV conduction with AFlutter is the presence of an AP (Accessory Pathway) in a patient with WPW (Antegrade conduction over the AP is faster than over the normal AV nodal pathway). Other reasons that might account for 1:1 AV conduction with AFlutter include use of a 1A or 1C antiarrhythmic agent — or hyperthyroidism (ie, these being 2 conditions that may also facilitate acceleration of AV conduction by either enhancing sympathetic tone — or by pharmacologic reduction of the AV node refractory period) — See Nigussie et al (Cureus 12(6): e8739, 2020) and Murthy et al (BMJ Case Rep, 2013).

===============================

Today's CASE Continues:
Follow-up on today's patient is unfortunately limited (ie, No EP study was done). There was a known history of hyperthyroidism, with the patient on medication for this condition. Therefore — 1:1 AV conduction of AFlutter may have been facilitated by hyperthyroidism. There was no history or current indication of WPW.
  • Today's patient was symptomatic in association with the rhythm shown in Figure-1, which I have repeated in the TOP panel of Figure-2. He was treated with IV Metoprolol — with the result of this treatment shown in the BOTTOM panel below.

  • How would YOU interpret ECG #2 in Figure-2?

Figure-2: ECG #2 shows the result of treatment with IV Metoprolol. (To improve visualization — I've digitized the original ECG using PMcardio).


ANSWER:
Treatment of the exceedingly rapid (ie, 1:1 AV conduction) pattern of AFlutter seen in ECG #1 — resulted in considerable slowing of the rhythm, as seen in ECG #2:
  • The rhythm in ECG #2 — is a regular tachycardia at a rate just under 150/minute (ie, about half as fast as the rhythm in ECG #1).
  • QRS morphology in ECG #2 clearly looks supraventricular — with now, only minimal QRS widening and incomplete RBBB conduction (ie, rSr' pattern in lead V1 — with narrow, terminal s waves in lateral leads I and V6). The bifascicular conduction pattern of complete RBBB/LPHB, that was seen in ECG #1 — has now resolved.
  • Atrial activity in the form of 2:1 AV conduction (best seen in lead V1) is now clearly seen.

  • IMPRESSION: The rhythm in ECG #2 now shows AFlutter with 2:1 AV conduction — with the ventricular rate being half the rate that was seen in ECG #1. Therefore — the IV Metoprolol succeed in reducing the rate of AV conduction of flutter from 1:1 (in ECG #1) — to 2:1 (in ECG #2).
  • Resolution of the bifascicular block with the slower ventricular rate suggests that QRS widening in ECG #1 was the result of rate-related aberrant conduction.


Today's CASE Concludes:
Although the ventricular rate in ECG #2 was reduced in half following administration of IV Metoprolol — the patient remained in AFlutter with the rapid ventricular response of ~140-145/minute. Cardiac CT was obtained to rule out atrial thrombus — after which synchronized cardioversion was performed — resulting in ECG #3, as shown in Figure-3.
  • What do you see in Figure-3?

Figure-3: ECG #3 shows the result of synchronized cardioversion. (To improve visualization — I've digitized the original ECG using PMcardio).


ANSWER:
Atrial flutter is an extremely responsive arrhythmia to synchronized cardioversion — with ECG #3 showing successful conversion to sinus rhythm. Note the change in P wave appearance (best seen in the limb leads) — with clear return of sinus P waves (ie, upright in lead II of ECG #3).
  • Judicious use of ß-blockers and control of hyperthyroidism were the post-cardioversion treatment measures undertaken.
  • The patient was referred for ablation of his AFlutter.


==========================================

Acknowledgment: My appreciation to Magnus Nossen (from Fredrikstad, Norway) for the case and this tracing.

==========================================


==================================

Related ECG Blog Posts to Today’s Case:

  • ECG Blog #205 — Reviews my Systematic Approach to 12-lead ECG Interpretation.
  • ECG Blog #185 — Review of the Ps, Qs, 3R Approach for systematic rhythm interpretation.

  • ECG Blog #215 — Reviews the Cabrera Format (and explores potential advantages of this more logical anatomical sequencing).
  • ECG Blog #114 — Reviews another case using the Cabrera format (from Romania)

  • ECG Blog #229 — reviews distinction between AFlutter vs ATach (and WHY AFlutter is so commonly overlooked).  
  • ECG Blog #287 — More on AFlutter.
  • ECG Blog #220 — reviews my LIST #1: = Causes of a Regular WCT.

  • The November 12, 2019 post in Dr. Smith's ECG Blog — in which I review my approach to a Regular SVT rhythm.

  • ECG Blog #196 — Reviews "My Take" on assessing the regular WCT (Wide-Complex Tachycardia) — with tips of distinguishing between VT vs SVT with either preexisting BBB or aberrant conduction.
  • ECG Blog #211 — Reviews WHY some early beats and some SVT rhythms are conducted with Aberration (and why the most common form of aberrant conduction manifests RBBB morphology).
  • ECG Blog #197 — Reviews the common forms of Idiopathic VT (including Fascicular VT). 

  • ECG Blog #18 and ECG Blog #37 — regarding very rapid rhythms with WPW.


================================== 

ADDENDUM (3/13/2023):
I've presented this material before — but it bears repeating for reference. These concepts should be automatic for assessment of the patient who presents with a regular SVT rhythm.


ECG Media PEARL #64 (10:50 minutes Audio) — Reviews my LIST #2: Common Causes of a Regular SVT Rhythm.


ECG Media PEARL #45 (10:00 minutes Audio) — Why is Atrial FIutter so commonly overlooked?

  • For those wanting a more advanced review regarding AFlutter — Check Out this article by García-Cosío F et al (Clinical Approach to ATach and AFlutter, Rev Esp Cardiol 65(4):363-375, 2012).


Wednesday, March 8, 2023

ECG Blog #367 — Recognize The KEY Finding?


You are given this ECG to review. No history is provided — except knowing that this patient was seen in the ED (Emergency Department).


QUESTION:
  • Is there a potential problem with this ECG?

Figure-1: The initial ECG in today's case.

===================================
NOTE: Many of us are charged with reviewing ECGs that have been interpreted by other clinicians — often without the benefit of much (or any) history. I did this for 30 years — overseeing (that is "overreading") the ECGs of 35 clinician colleagues. 
  • Given a "pile" of ECGs to review without benefit of the history — I had to "strike a balance" between pulling the chart (or calling the clinician) for each tracing (to see if the ECG was correctly interpreted) — and — my time constraints to finish "the pile" as time efficiently as possible, so that I could get on to my "normal" daily tasks. As a result — I had to be selective about which ECGs I needed to find out more about.
  • This is relevant to today's case — because the ECG in Figure-1 is a tracing that mandates: i) Finding out what the history is (which since we know the patient was seen in the ED — most probably entails chest pain that may be new); and, ii) Pulling the chart or calling the clinician to find out what was done clinically.
===================================

MY Thoughts on the ECG in Figure-1:
Today's case highlights a subtle-but-critical ECG finding that all-too-often is missed. It was missed in today' case. As a result — cardiac cath (and reperfusion of an acutely occluded LCx [ = Left Circumflex ]) artery — was delayed for 9 hours, until markedly elevated troponin values finally brought attention to this case.
  • The rhythm in ECG #1 is sinus. Intervals (PR, QRS, QTc) and the mean QRS axis are normal. There is no chamber enlargement (Not shown in Figure-1 is indication of the normal 10 mm = 1 mV standardization mark).
  • Assessment of ST-T wave appearance in the limb leads of ECG #1 is essentially normal.
  • In the chest leads — R wave progression is appropriate, with transition (where the R wave becomes taller than the S wave is deep) occurring normally between leads V3-to-V4.

KEY Point: The abnormal leads in today's tracing are leads V2, V3 and V4.
  • Normally — there is a small amount of gentle-upsloping ST elevation in leads V2 and V3. This is not what we see in ECG #1. Instead — there is no ST elevation at all in V2,V3 — and there is straightening of the ST segments in leads V2,V3,V4 (RED lines in leads V2,V3,V4 in Figure-2).

  • In addition — the T waves in leads V2,V3 look taller-than-expected (given height of the R wave in these respective leads). In addition — these T waves look "fatter"-at-their-peak and wider-at-their-base than they should be given QRS amplitude in these leads.

  • To EMPHASIZE: These are subtle findings. But, in a patient who presents to the ED for new chest pain — seeing these subtle findings that are localized to leads V2-thru-V4 should at the least make you consider acute posterior OMI (Occlusion-based MI) — until you prove otherwise. The increased amplitude and volume of the T waves in leads V2,V3 may represent "reperfusion" T waves.

Figure-2: I've labeled the ECG from Figure-1 — to highlight the subtle-but-real ST segment flattening in leads V2,3,4 of ECG #1. If this patient was having new chest pain — the T waves in leads V2 and V3 may be hyperacute (See text).


Today's CASE Continues:
Some time after ECG #1 — a repeat ECG was obtained ( = ECG #2 in Figure-3).
  • What do YOU think?

Figure-3: The repeat ECG — done a bit after ECG #1.


MY Thoughts on the Repeat ECG:
It is difficult to assess the limb leads in ECG #2. This is because there are artifactual undulations in the baseline that result in some variation of ST-T wave morphology from one-beat-to-the-next. That said — I thought there were some definite changes in the chest leads.
  • To EMPHASIZE: The ST-T wave changes in ECG #2 (compared to ECG #1) — are subtle and EASY to overlook unless one compares ST-T wave appearance by looking lead-to-lead, one lead at a time. To facilitate this comparison — I have put the chest leads from ECG #1 and ECG #2 side-by-side in Figure-4.

Figure-4: Comparison of the chest leads from ECG #1 and ECG #2. Do you appreciate the changes that I've labeled in the repeat ECG?


Lead-by-Lead Comparison of Chest Leads in Figure-4:
For optimal lead-by-lead comparison — QRS morphology for the 2 tracings you are comparing should be as similar as possible. This is because significant change in QRS morphology would suggest some variation in lead placement that may clearly affect ST-T wave appearance.
  • Apart from slight increase in R wave amplitude in leads V4 and V5 of ECG #2 — there is no significant difference in QRS morphology between the 2 tracings shown in Figure-4. This suggests that any difference in ST-T wave morphology between these 2 tracings is likely to represent a "real" difference due to an ongoing ischemic process.

  • Compare ST-T wave appearance of the 2 leads within the RED-GREEN rectangle in ECG #2 — with ST-T wave appearance of leads V2,V3 in ECG #1. Don't the ST segments in leads V2,V3 of ECG #2 look straighter, with more distinct angulation between the end of the ST segment and the start of the T wave ascent?
  • Isn't the ST segment takeoff in leads V5,V6 of ECG #2 straighter than it was — compared to its appearance in leads V5,V6 of ECG #1? (comparison of RED vs BLUE lines in these leads). 
  • Isn't there also now some J-point ST elevation in leads V5,V6 of ECG #2? (RED arrows in these leads).

  • KEY Point: Unfortunately, we lack important information about clinical correlation in today's case: i) We do not know how much time passed between recording the 2 tracings in Figure-4; ii) We do not know about the presence (and relative severity) of chest pain at the time each tracing was recorded (ie, Was chest pain increased when ECG #2 was recorded?).

  • BOTTOM Line: What we do know — is that this patient presented to the ED presumably for new symptoms — and that the subtle-but-real ST-T wave abnormalities seen in ECG #1 have increased in ECG #2. This qualifies as "dynamic" ST-T wave change — and in a patient with new chest pain, this is indication for prompt cath to define the anatomy and ensure reperfusion. 
  • The ST-T wave changes we describe above localize to the posterior wall (ie, the ST-T wave changes in leads V2-V4) — and to the lateral wall (the ST-T wave changes in leads V5,V6 of ECG #2) — which suggest acute LCx (Left Circumflex) occlusion until proven otherwise.


CONCLUSION of Today's Case:
The subtle-but-real ST-T wave changes in today's initial tracing — as well as the equally subtle-but-real "dynamic" ST-T wave changes seen in the repeat tracing — went unrecognized for 9 hours. Maximum Troponin I elevation attained 30,000. Cardiac cath revealed acute LCx occlusion.
  • Fortunately — this patient did well, and was discharged with surprisingly good LV function. But there are important lessons to be learned from this case!


==========================================

Acknowledgment: My appreciation to Magnus Nossen (from Fredrikstad, Norway) for the case and this tracing.

==========================================


==================================

Related ECG Blog Posts to Today’s Case:

  • ECG Blog #205 — Reviews my Systematic Approach to 12-lead ECG Interpretation.

  • ECG Blog #193 — illustrates use of the Mirror Test to facilitate recognition of acute Posterior MI. This blog post reviews the basics for predicting the "Culprit" Artery — as well as the importance of the term, "OMI" ( = Occlusion-based MI) as an improvement from the outdated STEMI paradigm.

  • ECG Blog #294 — How to tell IF the "culprit" artery has reperfused.
  • ECG Blog #194 — AIVR as a sign that the "culprit" artery has reperfused.

  • ECG Blog #260 — Reviews when a T wave is hyperacute — and the concept of "dynamic" ST-T wave changes.
  • ECG Blog #230 — How to compare serial ECGs.

  • ECG Blog #337 — an OMI misdiagnosed as an NSTEMI ...

  • ECG Blog #285 — for another example of acute Posterior MI (with positive Mirror Test).
  • ECG Blog #246 — for another example of acute Posterior MI (with positive Mirror Test).
  • ECG Blog #80 — reviews prediction of the "culprit" artery (with another case to illustrate the Mirror Test for diagnosis of acute Posterior MI).

  • ECG Blog #184 — illustrates the "magical" mirror-image opposite relationship with acute ischemia between lead III and lead aVL (featured in Audio Pearl #2 in this blog post). 
  • ECG Blog #167 — another case of the "magical" mirror-image opposite relationship between lead III and lead aVL that confirmed acute OMI.

  • ECG Blog #271 — Reviews determination of the ST segment baseline (with discussion of the entity of diffuse Subendocardial Ischemia).

  • ECG Blog #258 — How to "Date" an Infarction based on the initial ECG.

  • The importance of the new OMI (vs the old STEMI) Paradigm — See My Comment in the July 31, 2020 post in Dr. Smith's ECG Blog.


============================================

ADDENDUM (3/8/2023):
The original tracing in today's case was recorded using the Cabrera lead format. This ECG recording format is favored in Norway, Sweden, Germany — and in a number of other countries. 
  • Given the ever expanding use of the internet — virtually all clinicians everywhere are likely to encounter this format at the very least, from time to time. As a result — I show in Figure-5, the initial ECG in today's case as it was originally recorded using the Cabrera format (Please see my Editorial Note near the top of the page in ECG Blog #365 for review of the basics of the Cabrera recording system). 

  • For comparison — I've reproduced in Figure-6 the initial ECG shown in today's case, in which I've simulated the standard recording format used in the U.S. and most other countries (ie, I inverted lead aVR — and moved the location of various limb leads).

Figure-5: The initial ECG in today's case — as it was originally recorded using the Cabrera format. (Given ever expanding use of the internet — it's good to become familiar with this recording format, that in many ways is more logical than the standard format we are used to).


Figure-6: For comparison purposes — I've reproduced the initial ECG in today's case that was shown in Figure-1.


=====================================
Included below are a series of links and other material relevant to detection of the “culprit” artery — and my thoughts for making the case to replace the term “STEMI” with “OMI” (in the hope of substantially increasing detection of acute coronary occlusion).

Free PDF Downloads from relevant Sections in my ECG-2014-ePub:

  • PDF File: Overview on the Cardiac Circulation and the “Culprit” Artery in Acute MI —
  • PDF File: Posterior MI and the “Mirror Test” —  


Figure-7: ECG findings to look for when your patient with new-onset cardiac symptoms does not manifest STEMI-criteria ST elevation on ECG. For more on this subject — SEE the September 3, 2020 post in Dr. Smith’s ECG Blog with 20-minute video talk by Dr. Meyers on The OMI Manifesto. For my clarifying Figure illustrating T-QRS-D (2nd bullet) — See My Comment at the bottom of the page in Dr. Smith’s November 14, 2019 post. 


====================================

NOTE: This Editorial just published by Drs. Steven Smith and Pendell Meyers details use of Hyperacute T-Waves in the diagnosis of acute OMI — "Hyperacute T-waves Can Be a Useful Sign of Occlusion MI IF Appropriately Defined" (Ann Emerg Med — March 3, 2023).
====================================


ECG Media PEARL #10 (10 minutes Audio) — reviews the concept of why the term “OMI” ( = Occlusion-based MI) should replace the more familiar term STEMI — and — reviews the basics on how to predict the "culprit" artery.


ECG Media PEARL #11 (6 minutes Audio) — Reviews how to tell IF the “culprit” (ie, acutely occluded) artery has reperfused, using clinical and ECG criteria.


Wednesday, March 1, 2023

ECG Blog #366 — Diltiazem didn't work ...


The ECG and long lead II rhythm strip in Figure-1 — was obtained from a COVID positive patient with persistent tachycardia not responding to Diltiazem.
  • How would YOU interpret this tracing?
  • How to manage the patient?

Figure-1: The initial ECG — obtained from a patient with persistent tachycardia. (To improve visualization — I've digitized the original ECG using PMcardio).


MY Thoughts on the ECG in Figure-1:
As always — I favor beginning my interpretation with assessment of the long lead rhythm strip at the bottom of the tracing. By the Ps, Qs, 3R Approach (See ECG Blog #185):
  • Regarding Regularity — the rhythm is irregularly irregular.
  • The Rate of the rhythm is rapid — with the R-R interval between 1.5 and 2.5 large boxes for most complexes on the tracing. This corresponds to an average heart rate of ~120/minute!
  • The QRS is narrow in all leads — so the rhythm is supraventricular.

  • P waves are present throughout the tracing. P wave morphology changes — almost from 1 beat to the next (See colored arrows in the long lead II rhythm strip of Figure-2). That said — P waves do appear to be Related to neighboring QRS complexes, as each of the 21 beats on the tracing is preceded by a P wave with reasonable PR interval.

Figure-2: I've color-coded P waves from Figure-1 according to P wave morphology (See text).


Putting It All Together:
The finding of a fast, irregularly irregular supraventricular rhythm — in which P waves precede neighboring QRS complexes, but with a constantly changing P wave morphology — defines the rhythm as MAT ( = Multifocal Atrial Tachycardia).
  • NOTE: For clarity — I've color-coded P waves in the long lead II rhythm strip according to morphology. The fact that there are no less than 11 changes in P wave morphology (ie, 11 different colors out of a total of 21 beats) — confirms the constantly changing P wave morphology characteristic of MAT.

PEARLS about MAT: 
Consider the following features regarding MAT:
  • MAT is not a common diagnosis. As a result, in order to differentiate MAT from the much more commonly encountered irregularly irregular rhythm (which is AFib) — we need to be certain we are seeing multiple different P wave morphologies that are constantly changing. The 11 different colors for the arrows in Figure-2 make it evident that we are! 
  • NOTE: In addition to the constantly changing P wave shapes — the PR interval in the long lead II is also constantly changing! This is another way to confirm that we are indeed seeing P waves arising from different atrial sites that change from one-beat-to-the-next.

  • MAT almost always occurs in one of 2 common predisposing settings. These 2 settings are: i) In patients with severe, often longstanding pulmonary disease; and/or, ii) In acutely ill patients with multi-system disease (ie, sepsis, shock, electrolyte and/or acid-base disorders). As a result — I’m reluctant to diagnose MAT in the absence of one of these 2 settings.

  • To EMPHASIZE: It is EASY to overlook the diagnosis of MAT because: i) The diagnosis is not common (It is less common than many clinicians appreciate); and, ii) P waves with changing morphology may not always be evident in all 12 leads. As a result — IF the 1 lead you are monitoring happens to be one in which P waves are not well seen — then you might assume the irregular rhythm in front of you was AFib. Remember — 12 leads are better than one! It is especially important to always obtain a 12-lead ECG whenever you see an irregularly irregular rhythm in association with one of the above 2 predisposing conditions that MAT is prone to occur in. 
  •  
  • MAT is not a Wandering Pacemaker. MAT is a pathologic rhythm in which P wave morphology changes from one-beat-to-the-next. In contrast — a wandering pacemaker is often a benign rhythm (if not a normal variant) — in which the heart rate is slower and there is a gradual shift in P wave morphology over a period of several beats, most often occurring in an otherwise healthy and asymptomatic patient.

  • Clinically, the importance of recognizing MAT — is that treatment is different than the treatment of AFib. Most of the time, the heart rate with MAT will not be excessive — so all that is usually needed, is to "find and fix" the underlying predisposing cause (ie, optimize oxygenation; treat sepsis, electrolyte or acid-base disorders). This is distinctly different than treatment objectives for AFib, which in addition to correcting the cause (and addressing anticoagulation issues) — consist of rate slowing, and medical or electrical cardioversion interventions. NOTE: Today's case is an exception to the above generality — in that the MAT rhythm in Figure-2 is surprisingly fast (ie, ~120/minute) — so that this is one of the occasional times when MAT does merit consideration of rate-slowing medication.


Applying the Above to Today's Case:
In addition to being Covid-positive — the patient in today's case had longstanding COPD. He was wheezing, and required supplemental oxygen.
  • The diagnosis of MAT is clearly supported in today's case by the clinical setting: i) The patient was symptomatic from longstanding pulmonary disease; ii) He was acutely ill, with a rapid irregular SVT not responding to medication; and, iii) He was Covid-positive — potentially with significant pulmonary involvement from this.

  • IV Verapamil or Diltiazem are good initial choices for MAT — when rate-slowing medication is needed (Today's patient was not responding to Diltiazem). It's important to optimize K+ and Mg++ levels (IV magnesium is at times a helpful adjunct). If the patient is not frankly wheezing — judicious use of an IV ß-blocker may help to control the ventricular rate.
  • Realistically — optimal rate control of this patient's MAT may not be possible until improvement of his pulmonary disease and underlying conditions.


==================================

Acknowledgment: My appreciation to Stanislav Galkin (from Enniskillen, Northern Ireland) for the case and this tracing. 

==================================

ADDENDUM (3/1/2023) — Additional material relevant to today's case:
  • How Covid-positivity in today's case may affect the heart.
  • Additional material on MAT.


Cardiac Manifestations of Covid-19:
Manifestations of heart disease may be seen in patients with Covid-19, including signs of myocardial injury. That said — many patients with Covid have surprisingly few symptoms of cardiac involvement — with detection of myocardial injury becoming evident primarily by cardiac testing (ie, from troponin elevation, cardiac arrhythmias, Echo abnormalities — or other forms of cardiac imaging). Myocardial injury with Covid may arise from a number of potential causes — which include:
  • Acute myocarditis.
  • Takotsubo (ie, Stress) Cardiomyopathy.
  • Acute MI.
  • Acute Right Heart Strain.
  • Hypoxic injury (from pneumonia or other acute pulmonary complication).
  • Acute pulmonary embolus.
  • ARDS (Adult Respiratory Distress Syndrome).
  • SIRS (Systemic Inflammatory Response Syndrome).
  • Microvascular dysfunction — cardiac vasculitis — intravascular thrombosis.

Although acute Myocarditis is often suspected as the cause of troponin elevation in Covid-positive patients — documented viral myocarditis caused by Covid appears to be much less common than initially thought (Up-to-Date — Caforio et al — Jan, 2023). 
  • In Covid patients with myocardial injury (be this from myocarditis or otherwise) — disease severity and prognosis tend to be proportional to the amount of troponin elevation — with better prognosis in those patients with fewer symptoms and limited (if not minimal) troponin elevation. That said — assessment of the direct effect that Covid has on outcome is difficult to determine, especially in older hospitalized patients more likely to have known (or previously undetected) underlying forms of cardiac or pulmonary disease.

==========================

Additional Points on MAT:


ECG recognition of MAT (3:20 minutes Video).


Figure-3: Summary of KEY points related to MAT.


==================================

Related ECG Blog Posts to Today’s Case:

  • ECG Blog #205 — Reviews my Systematic Approach to 12-lead ECG Interpretation.
  • ECG Blog #185 — Review of the Ps, Qs, 3R Approach for systematic rhythm interpretation.

  • ECG Blog #199 — for Review of MAT.
  • ECG Blog #65 — for an example of MAT in a patient with chronic pulmonary disease (plus more on the differential diagnosis of MAT).
  • ECG Blog #200 — for an example of Wandering Atrial Pacemaker.

I link to 2 additional illustrative Cases taken from Dr. Smith’s ECG Blog. For each of these posts — Please scroll down to the bottom of the page to see My Comment. These cases provide insight to assessment for MAT:
  • The January 5, 2020 post in Dr. Smith’s ECG Blog — for an example of MAT.
  • The September 30, 2019 post in Dr. Smith’s ECG Blog — for an example of “MAT”, but without the tachycardia ...