Saturday, March 12, 2022

ECG Blog #290 (84a) - Errors in ECG Interpretation


The ECG shown in Figure-1 was sent to me for my opinion. All I was initially told — was that the chest X-ray and Echo from this middle-aged man were normal — and that correct electrode lead placement was verified.  
  • How would YOU interpret this tracing?

Figure-1: ECG that was sent to me with limited clinical information (See text).


=======================================

NOTE: Some readers may prefer at this point to listen to the 9:00 minute ECG Audio PEARL before reading My Thoughts regarding the ECG in Figure-1. Feel free at any time to refer to My Thoughts on this tracing (that appear below ECG MP-84a).

=======================================

Today’s ECG Media PEARL #84a (9:00 minutes Audio) — Reviews my observations on some Common Errors in ECG Interpretation (Part-1) — with attention to the cardiac rhythm. 


My THOUGHTS on ECG #1:

As always — I approached the ECG shown in Figure-1 systematically — beginning with assessment of Rate and Rhythm (See ECG Blog #205 for my Systematic Approach to 12-Lead ECGs): 

  • QUESTION #1: Did YOU Notice that a simple sinus rhythm is not present in Figure-1 — because the P wave at the beginning of the long lead II rhythm strip is not upright? (YELLOW arrows in Figure-2).

  • QUESTION #2: Did YOU Notice in Figure 2, that the P wave becomes positive after beat #7?

Figure-2: I've labeled P waves in ECG #1. Did YOU Notice that the first 6 P waves in the long lead II rhythm strip are negative?


Today's Audio Pearl reviews a number of Common Errors in ECG Interpretation. One of the most prevalent errors (even among experienced clinicians) — is the failure to begin interpretation by spending the less than 5 seconds it takes to seek out a long lead II rhythm strip — and routinely look in front of each QRS complex to see IF it is preceded by an upright P wave in lead II.
  • IF the P wave in lead II is not upright in front of neighboring QRS complexes — then (assuming there is no dextrocardia or lead misplacement) — the rhythm is not sinus. 
  • Note that although the P wave is negative in each of the inferior leads for the first 6 beats — the P wave is positive in simultaneously-recorded lead aVL for beats #4,5,6. This tells us that atrial activity is traveling backward (retrograde) with respect to the inferior leads — and towards high lateral lead aVL, which defines this as either a Low Atrial or slightly accelerated Junctional Rhythm (See My Comment in the January 28, 2019 post of Dr. Smith's ECG Blog for distinction between these 2 rhythms).

QUESTION #3: What happens in Figure-2 to the P wave in the long lead II rhythm strip after beat #6?
  • Advanced QUESTION #4: Can you explain why this change in P wave morphology after beat #6 occurs? 


ANSWER:
The P wave in front of beat #7 in lead II becomes tiny and isoelectric (RED-YELLOW arrow in Figure-3). After beat #7 — the P wave becomes positive in lead II, and remains so for the rest of the tracing.
  • The change to a positive P wave with a constant and normal PR interval preceding beats #8-thru-13 indicates resumption of sinus rhythm.
  • Verification that the RED-YELLOW arrow in front of beat #7 is in fact pointing to a P wave — is forthcoming from looking in front of beat #7 in the simultaneously-recorded long lead V1 rhythm strip. I suspect that the tiny, isoelectric deflection in front of beat #7 in the long lead II represents an atrial fusion beat at the time of transition from the low atrial (or junctional) rhythm seen for the first 6 beats — to the sinus rhythm that takes over after beat #7.


The reason WHY sinus rhythm resumes after beat #7 is illustrated in Figure-3, in which I have measured (in milliseconds) the R-R interval for each of the beats in this tracing:
  • Although subtle — the rhythm in the long lead rhythm strip is not regular. This is difficult to determine without the use of calipers!

  • PEARL #1: Calipers are not needed for interpretation of many rhythms. The reason calipers are so helpful in today's case — is that they allow you to quickly determine that the reason sinus rhythm resumes after beat #7, is that the sinus rate speeds up enough to overtake the slightly slower low atrial (or junctional) rhythm. A more extended period of monitoring would probably reveal an underlying sinus arrhythmia — with periodic slowing sufficient to allow an ectopic atrial (or slightly accelerated junctional) focus to intermittently take over the rhythm. As opposed to a usurping rhythm — intermittent sinus slowing (with exchange between another pacemaking site) is much more likely to represent a benign phenomenon.


Figure-3: I've labed sinus P waves with RED arrows. Note that the R-R interval decreases for a few beats after beat #7. This allows sinus rhythm to take over (See text).


Let's Complete Our Interpretation of Today's Tracing:
Having assessed the Rate and Rhythm in Figure-3 — Let's complete our systematic interpretation of this 12-lead tracing.
  • Intervals: The PR interval for sinus-conducted beats #8-thru-13 is normal. The QRS is narrow — and the QTc does not appear to be prolonged.
  • Axis: Normal (about +40 degrees).
  • Chamber Enlargement: None.

Regarding Q-R-S-T Changes:
  • Q Waves: None.
  • R Wave Progression: Normal. Transition (where height of the R wave becomes taller than the S wave is deep) occurs normally between leads V2-to-V3. There is an r' (ie, terminal positive deflection) in lead V2 — which probably reflects slight electrode lead misplacement, as an isolated terminal r' in lead V2 but not V1 or V3 does not make anatomic sense. That said — this is unlikely to affect the overall interpretation of todays' tracing.
  • ST-T Wave Changes: There appears to be slight J-point ST elevation in each of the inferior leads. Reciprocal ST depression is not seen in lead aVL — and there are no significant ST-T wave changes in other leads.

PEARL #2: The appearance of ST elevation in the inferior leads of Figure-3 reflects the Emery Phenomenon — in which the oppositely-directed atrial repolarization wave (ie, the T of the P wave) produces a "pseudo"-ST elevation effect because of the relatively large size of the negative inferior lead P waves, with short PR interval for the first 6 beats of the tracing.
  • Most of the time — the Tp (also known as the "Ta" or atrial T wave) is hidden within the QRS complex. But on those uncommon occasions when a large negative P wave with short PR interval is seen in the inferior leads — the resultant oppositely-directed Tp may simulate acute inferior infarction (See My Comment in the June 3, 2020 post in Dr. Steve Smith's ECG Blog for discussion of the Emery Phenomenon in the context of a case that went to cath because of this "pseudo"-ST elevation).

My Clinical Impression of ECG #1:
The underlying rhythm is sinus arrhythmia — with intermittent takeover by a rhythm manifesting negative inferior lead P waves with a short PR interval (either a low atrial or slightly accelerated junctional escape rhythm). There may be slight electrode lead misplacement of lead V2. There is "pseudo"-ST elevation in the inferior leads during periods of the escape rhythm (due to the Emery Phenomenon) — but there are no acute changes.


CASE Follow-Up:
Additional history on today's patient revealed that the reason this ECG was done — was dizziness and a syncopal episode. On further evaluation — the patient was found to be hypovolemic with orthostatic hypotension — and this was thought to be the cause of his syncope. Treatment was with volume replacement. Echo showed excellent systolic function, without any localized wall motion abnormality.
  • My thought on learning this additional history was that this rhythm was probably benign — and given the rate-related dependence of this rhythm shown in Figure-3 — I thought this ectopic rhythm would probably resolve as volume replacement was accomplished.


=======================
Acknowledgment: My appreciation to Hosam Shabib (from Doha, Qatar) for the case and this tracing.
=======================


Additional Relevant Material to Today's Case:
  • See ECG Blog #185 — for review of the Systematic Ps, Qs, 3R Approach to rhythm interpretation.
  • See ECG Blog #205 — Reviews my Systematic Approach to 12-lead ECG Interpretation.

  • See ECG Blog #196 and ECG Blog #263 and ECG Blog #220 — for Review on assessing the regular WCT rhythm. 
  • See ECG Blog #197 and ECG Blog #278 — for Review of the Idiopathic VTs (ie, RVOT VT, Fascicular VT, others).

  • See ECG Blog #211 — for Review of why some beats conduct with Aberration.
  • See ECG Blog #42 — for Review of Criteria for distinguishing between VT vs SVT with Aberration or Preexisting BBB.

  • See ECG Blog #240 — for Review on the ECG assessment of the patient with a regular SVT rhythm (including distinction between the various types of SVT reentry).

  • See ECG Blog #214 — for Review of why I emphasize the phrase, "12 Leads are Better than One".

  • See ECG Blog #235 and ECG Blog #286 — for, "Some Simple Steps to Help Interpret Complex Rhythms".

  • See ECG Blog #193 — for Review of the term, "OMI" ( = Occlusion-based MI).
  • See ECG Blog #218 and ECG Blog #260 — for Review of WHEN a T-wave is Hyperacute.

  • See ECG Blog #204 and ECG Blog #282 — for Review of a user-friendly approach for the ECG Diagnosis of the Bundle Branch Blocks (RBBB/LBBB/IVCD) in a matter of seconds!

  • For more on distinction between Low Atrial vs Junctional Rhythm — Please see My Comment at the BOTTOM of the page in the January 28, 2019 post in Dr. Smith's ECG Blog.
  • For more on the Emery Phenomenon — Please see My Comment at the BOTTOM of the page in the June 3, 2020 post in Dr. Smith's ECG Blog.


Tuesday, March 8, 2022

ECG Blog #289 — Artifact or a Giant Wave?


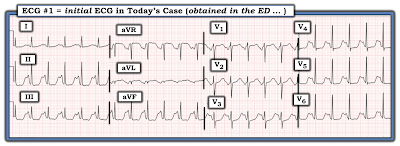
The ECG in Figure-1 was obtained from a previously healthy woman in her mid-30s — who presented to the ED (Emergency Department) with palpitations. She was hemodynamically stable.


QUESTIONS:

  • How would YOU interpret the ECG in Figure-1?


Figure-1: ECG from a prevously healthy young woman with palpitations.


My THOUGHTS on ECG #1:

As always — I approached the ECG shown in Figure-1 systematically (See ECG Blog #205 for my Systematic Approach to 12-Lead ECGs). My interpretation was as follows: 

  • The QRS complex is narrow — so the rhythm is supraventricular.
  • The rhythm is rapid (ie, ~135-140/minute) and regular.
  • P waves do appear to be present! These P waves look bizarre in lead II (and in the other inferior leads) — because of the highly unusual ST segment and T wave (See below). But the definite negative P wave deflection, with similar PR interval that is clearly seen in leads V1 and V2 confirms that sinus P waves are present! So the rhythm is a very rapid Sinus Tachycardia at ~135-140/minute.

Continuing with my Systematic Approach:
After assessment of Rate and Rhythm — I favor looking at Intervals (PR/QRS/QTc):
  • The PR interval for the tachycardia seen in Figure-1 appears to be normal (ie, It is common for the PR interval to shorten a bit with tachycardia).
  • As already noted — the QRS complex is narrow.
  • However, the 3rd interval ( = the QTc = the QT interval corrected for heart rate) — is markedly prolonged. Assessment of the QTc becomes progressively more difficult as the heart rate becomes faster (especially at rates well over 100/minute). That said, the QT interval for ECG #1 in Figure-1 takes up at least 3/4 of the R-R interval! — so that despite the fast heart rate, the QTc is obviously markedly prolonged.

  • The frontal plane Axis in Figure-1 is normal (about +70 degrees).
  • Chamber Enlargement – None.

==================================

PEARL #1: Even before completing our systematic assessment of the ECG in Figure-1 — I think it worthwhile to introduce the short LIST of Causes of QTc Prolongation that should routinely be considered whenever you encounter a prolonged QTc. This list becomes especially relevant given the dramatic increase in the QTc seen in ECG #1. Assuming there is no bundle branch block, ischemia or infarction (as these entities can prolong the QT) — THINK OF 3 principal Causes:

  • i) DRUGS (many drugs prolong the QT interval — and combinations of drugs may result in marked prolongation).
  • ii) LYTES (ie, Think of low K+ and/or low Mg++ and/or low Ca++) 
  •                      — and/or — 
  • iii) a CNS Catastrophe (ie, stroke, bleed, coma, seizure, trauma, brain tumor). 

  • NOTE: Since the patient in today's case is a previously healthy young woman who is alert enough to complain of "palpitations" — it would seem that a CNS Catastrophe is unlikely. We might also infer that this otherwise healthy young adult woman would probably not be on sufficient medication (ie, "Drugs") to cause marked QTc prolongation. Therefore, even before completing our systematic assessment — recognition of the markedly prolonged QTc should immediately prompt consideration of electrolyte disturbance (ie, "Lytes") as a very possible underlying cause.

==================================


Regarding Q-R-S-T Changes for the ECG in Figure-1:

  • Q waves: There is a tiny Q wave (QS complex) in lead aVL.
  • R wave progression: Normal — with transition (ie, the point where the R wave gets taller than the S wave is deep) occurring normally between leads V3-to-V4.
  • ST-T wave changes: Bizarre! ST segments are surprisingly flat in multiple leads (ie, II,III,aVF; and in V4,V5,V6). As I noted earlier — despite the tachycardia, the QTc is markedly prolonged. 

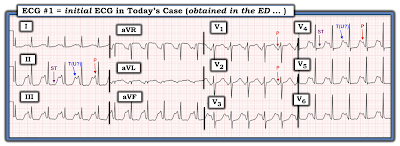
  • NOTE: For clarity, I have labeled in Figure-2 — selected P waves (in leads II,V1,V2,V4) — and, I've added labels to distinguish between the depressed, flattened ST segments and their neighboring T (and/or U) waves in leads II and V4.

Figure-2: I have labeled the intervals I describe above in the text. NOTE: My landmarks for orientation are the negative P waves in leads V1 and V2 (which I know are sinus P waves!). This P wave landmark confirms for me that the RED arrows I have placed in leads II and V4 are truly pointing to sinus P waves in those leads. I suspect the reason for the huge P wave downslope in lead II is less the "size" of this P wave — and more the fact that the T waves (and/or U waves) are so tall, and the ST segment is placed so low in this bizarre-looking ECG.


CONFESSION: I initially thought the bizarre-looking ST-T waves in Figure-1 were the result of artifact. But as illustrated in Figure-2 — I'm now convinced these deflections are real, and that this ECG simply represents sinus tachycardia with diffuse ST segment flattening and depression + a markedly prolonged QT (or Q-U) interval.
  • LAB RESULTS: The "Clinical Answer" explaining the bizarre appearance of this ECG became evident with return of initial lab results. Serum K+ was markedly decreased = 2.6 mEq/L (Serum Mg++ was similarly decreased).

==================================
What are the ECG Findings of Hypokalemia? 
In my experience — the ECG is not an overly reliable tool for assessing for assessing mild-to-moderate hypokalemia, as both sensitivity and specificity of ECG findings for less-than-severe hypokalemia are relatively low. That said — the changes that one looks for are sequentially illustrated in Figure 3.

Figure-3: Sequential development of ST-T wave changes of hypokalemia. Note increasing U wave amplitude (See text).


To the contents in Figure-3 — I’d add the following points:
  • Not all patients read the textbook. I’ve seen many patients with all of the ECG findings shown in Figure-3 who had normal serum K+. I’ve also seen patients with mild-to-moderate hypokalemia who did not manifest any of the signs in Figure-3. Thus, in my experience — the ECG is less than optimally sensitive or specific as a tool for detecting mild-to-moderate hypokalemia. That said — with more severe degrees of Hypokalemia, the ECG tends to do much better in its prediction, and the ECG is very unlikely to be "normal".

  • PEARL #2 — The finding of U-waves is not specific for hypokalemia! U waves may also be found in patients with LVH and/or bradycardia, and occasionally as a normal variant. That said — when U waves are present, and the clinical history is consistent with (or suggestive of) hypokalemia (as in a patient with vomiting, weakness, a history of alcohol abuse — or in someone taking diuretics) — prompt assessment of serum electrolytes becomes essential!

  • PEARL #3 — IF U waves are so large that they become bigger than (or almost as big as) T waves — then the ECG becomes much more reliable for predicting significant hypokalemia (Panels E and F in Figure-3).

  • PEARL #4 — In my experience — Hypomagnesemia produces virtually identical ECG changes as hypokalemia. This is important — because serum Mg++ levels are not necessarily included in chem profiles unless specifically ordered. Low body magnesium is often encountered in association with other electrolyte abnormalities (ie, low sodium, potassium, calcium or phosphorus); acute MI; cardiac arrest; digoxin/diuretic use; alcohol use and abuse; renal impairment.


==================================
What are the ECG Findings of HypoCalcemia?  
Hypocalcemia generally prolongs the QT interval. It is therefore one of the entities on our short LIST to immediately think of whenever you recognize QT prolongation.
  • PEARL #5: In theory — pure hypocalcemia does not affect the T wave! As a result — the characteristic ECG picture of hypocalcemia is that of a flat and prolonged ST segment, at the end of which occurs a surprisingly normal-looking T wave. 
  • NOTE: This characteristic picture for hypocalcemia may of course change IF the patient also has hyper- or hypokalemia (as in today's case — in which associated hypokalemia might account for those large T/U waves at the end of the prolonged flattened ST segments).
  • Unfortunately, I do not know what the serum Ca++ level was in today's case. However — the fact that the ST segments are so flat in multiple leads in ECG #1 makes me wonder IF in addition to hypokalemia and hypomagnesemia — there may also have been hypocalcemia.


==================================

  • CLICK HERE — for download PDF of Section 11 (from my ECG-2014-ePub) on the ECG Diagnosis of Electrolyte Disorders.

==================================


Today's CASE Continues:

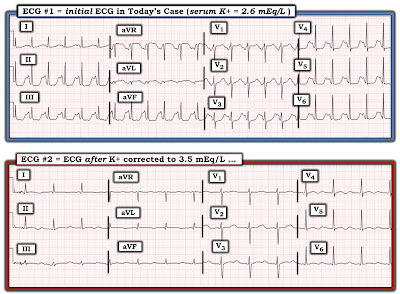
The patient in today's case was treated with electrolyte replacement. Figure-4 shows the follow-up ECG #2 — that was obtained after partial K+ replacement, at which time serum K+ = 3.5 mEq/L (compared to the initial serum K+ value = 2.6 mEq/L, at the time ECG #1 was recorded).


QUESTIONS regarding Figure-4:

  • Are there still ECG findings suggestive of hypokalemia in ECG #2?
  • How does ECG #2 compare with ECG #1?


Figure-4: Comparison of the initial ECG in todays case (when serum K+ = 2.6 mEq/L) — with the follow-up ECG done when serum K+ = 3.5 mEq/L.


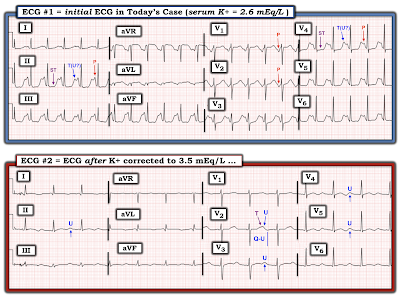
ANSWERS (which I have labeled in Figure-5):
Note that the heart rate has slowed markedly in ECG #2.
  • Did YOU Notice that we do not clearly see an upright P wave in lead II of ECG #2? There does appear to be a small, upright P wave with a short PR interval in leads I and aVL of ECG #2 — and a small, negative P wave with short PR interval in lead III. Thus, the rhythm in ECG #2 is not sinus. Instead — there appears to be a Low Atrial Rhythm.

  • Among the ECG findings of hypokalemia described in Figure-3 that persist in ECG #2 are: i) Nonspecific ST segment flattening in multiple leads; and, ii) Persistent U waves (that are most prominent in the leads that I've labeled in Figure-5). 
  • Note that as serum K+ increases — it becomes easier to define the limits of the U waves that I have labeled.
  • Note also that the Q-U interval remains prolonged — and that U wave amplitude uniformly exceeds the height of those T waves just before them. That said — the ST segment in multiple leads is clearly not as straight and depressed as it was in ECG #1 — and the giant U waves seen in ECG #1 are considerably smaller in ECG #2.

  • PEARL #6: Although serial ECGs will generally show regression of many of the ECG findings of hypokalemia as electrolyte deficiencies are corrected — there is no linear relationship between serum K+ levels and ECG appearance. There may also be a "lag" in time before corrective ECG changes are seen. That said — I viewed it as encouraging that the overall ECG changes of hypokalemia were less marked in ECG #2.

Figure-5: I've labeled the comparison tracings shown in Figure-4.


The "Baseline" ECG:

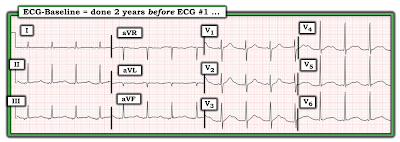
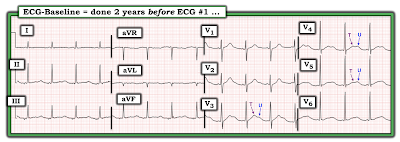
Perusal of the patients medical chart revealed a "baseline" ECG done 2 years prior to ECG #1 (See Figure-6).


QUESTION:

  • Do you think the serum K+ level was normal at the time the "baseline" ECG shown in Figure-6 was obtained?


Figure-6: The "baseline" ECG of today's patient, obtained 2 years before ECG #1.


ANSWER:

One of the problems that I've encountered when "baseline" ECGs are found — is failure to seek out information regarding the patient's clinical condition at the time that the "baseline" tracing was done.

  • IF a patient's "baseline" ECG was obtained at a time when they were acutely ill — then comparison of this previous ECG with the patient's current ECG will not necessarily tell us if ECG changes are new (because the patient could have been having a recurrence of his/her cardiac problem at the time that prior tracing was recorded).
  • I suspect that the previous ECG shown in Figure-6 was not truly a "baseline" tracing — because a number of ECG findings highly suggestive of hypokalemia were present at that time. These include (as shown in Figure-7): i) Non-specific ST-T wave flattening in each of the limb leads; and, ii) Prominent U waves in the leads I have labeled (with U wave amplitude exceeding T wave amplitude in leads V4 and V5).

  • PEARL #7 — I have found it insightful (when possible) to follow patients who have severe electrolyte disorders, with serial ECGs. Doing so allows you to follow the evolution of ST-T wave and U wave changes as serum electrolytes are corrected. As is the case for hyperkalemia — You have NO idea as to what this patient's true "baseline" ECG looks like until you repeat the ECG after you have corrected serum electrolytes.

  • PEARL #8: In my experience — The ECG picture of hypokalemia comes in many forms. Most of the time — these different forms end up being some variation of the U wave.

  • P.S. — Once again, the rhythm in Figure-7 is not sinus, because there is no clearly upright P wave in lead II. Instead — the small amplitude P wave with short PR interval in lead I — together with slight negativity of the P wave in each of the inferior leads once again suggests a low atrial rhythm.


Figure-7: I've labeled the "baseline" ECG shown in Figure-6.


=======================
Acknowledgment: My appreciation to Melvin Lee and Klanseng Ng (from Kluang, Malaysia) for the case and this tracing.
=======================


Additional Relevant Material to Today's Case:
  • See ECG Blog #205 — Reviews my Systematic Approach to 12-lead ECG Interpretation.

  • ECG Blog #152 — for Review through a case on Assessment of the QTc Interval.

  • ECG Blog #27 — for a Review of a case with Hypokalemia.

  • The May 9, 2020 post in Dr. Smith's ECG Blog (Please see My Comment at the bottom of the page) — for Review on the "Many Faces" of Hypokalemia.
  • The March 19, 2019 post in Dr. Smith's ECG Blog (Please see My Comment at the bottom of the page) — for Review of a handy method to rapidly Estimate the QTc and for discussion of a case with a prolonged QTc due to Hypocalcemia.
  • The May 3, 2020 post in Dr. Smith's ECG Blog (Please see My Comment at the bottom of the page) — for Review of a case with a long QTc and profound ST-T wave abnormalities due to Hypokalemia.


Thursday, March 3, 2022

ECG Blog #288 — PVCs and a Run of VT?


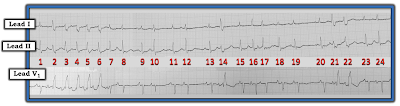
The long 3-lead rhythm strip in Figure-1 was obtained from an elderly woman awaiting non-emergent surgery. The concern was the frequent ventricular ectopy — with runs of non-sustained VT (Ventricular Tachycardia), as seen at the beginning of the tracing. She was treated with several antiarrhythmic medications — but without success. She was hemodynamically stable.
  • YOUR thoughts on this case? 
  • HINT: The optimal answer will address both the rhythm diagnosis and clinical management.

Figure-1: ECG obtained from an elderly woman awaiting surgery.


=======================================

NOTE #1: Some readers may prefer at this point to listen to the 8:00 minute ECG Audio PEARL before reading My Thoughts regarding the ECG in Figure-1. Feel free at any time to review to My Thoughts on this tracing (that appear below ECG MP-29).

=======================================

Today’s ECG Media PEARL #29 (8:00 minutes Audio) — Reviews WHAT the Ashman Phenomenon is — HOW to use it clinically? — and — whether the Ashman phenomenon is accurate when the underlying rhythm is AFib?

  • NOTE #2: For detailed review of the Ashman Phenomenon — with illustration of its clinical application — Please See ECG Blog #70. Use of the Ashman phenomenon with AFib is reviewed in ECG Blog #71.
  • NOTE #3: Additional material relevant to today's case can be found below in the Addendum.
===================================


MY Approach to Today's Case:
The ECG in Figure-1 was sent to me with the limited clinical information noted above. My thoughts were the following:
  • The first priority in assessing any acute arrhythmia — is to ensure that the patient is hemodynamically stable. Once you have done so — then by definition, you have at least a moment of time to interpret the rhythm.

  • In my experience — the most accurate and time-efficient way to interpret any cardiac arrhythmia — is to use a Systematic Approach. As emphasized often on this ECG Blog — I favor the Ps, Qs, 3R Approach (See ECG Blog #185).

  • PEARL #1: In addition to using a systematic approach and using calipers — I find it extremely helpful to look for an underlying rhythm. Simply stated — when there is more than one active feature in the rhythm — LOOK FIRST for the EASIER elements to interpret. Save the more difficult elements for later. For example, in Figure-1 — I would save the run of wider, faster beats (ie, beats #2-thru-6) until after I’ve assessed other parts of this tracing that look to be easier to interpret.

Applying the Ps, Qs, 3R Approach:
Looking at the rhythm in Figure-1 (while keeping the concept from Pearl #1 in mind) — MY Thoughts were the following:
  • Ignoring the wider beats for the time being (as per Pearl #1) — the QRS in all 3 leads is narrow for the remaining beats ( = beats #1; 7-13; 15-20; and 23, 24). Therefore — the underlying rhythm is supraventricular.

  • This underlying rhythm for these narrow beats is not Regular. As a result, the Rate varies — but a tachycardia is present, as the R-R interval is virtually always less than 3 large boxes in duration (ie, the average rate is clearly over 100/minute).
  • P waves are present — and they do appear to be Related to neighboring QRS complexes, in that a P wave precedes virtually all QRS complexes.

  • PEARL #2: P wave morphology appears to be changing, almost from beat-to-beat thoughout the entire rhythm strip in Figure-1. This constantly changing P wave morphology is subtle-but-real, although not easy to appreciate from lead V1 — because most P waves in this lead are pointed. The KEYS to appreciating the variation in P wave morphology are to: i) Note that the PR interval does not remain the same; and, ii) Look at P waves in each of the simultaneously-recorded leads. For example, although the P wave preceding beats #11, 12 and 13 in lead V1 is pointed at its peak — the change in morphology from one P wave to the next preceding these same beats #11, 12 and 13 is much more obvious in simultaneously-recorded leads I and II. 
  • Looking closely — the P waves preceding beats #14, 21 and 24 in lead V1 appear to be biphasic. While true that it sometimes is difficult to distinguish between variations in P wave morphology that result from baseline artifact or the "normal" variation in shape than can often be seen between one sinus P wave and the next — I interpreted the above described variation in P wave morphology as real.

Putting It All Together:
From the above (and still not yet looking at the wider beats in Figure-1 = beats #2-thru-6; 14 and 21,22) — we have described an irregularly irregular supraventricular (ie, narrow-QRS) tachycardia — in which there is constant variation from beat-to-beat in P wave morphology and in the PR interval. Isn't this the perfect description for MAT (Multifocal Atrial Tachycardia) as the underlying rhythm in today's case?

  • MAT is not a common diagnosis. As a result, in order to differentiate MAT from the much more commonly encountered irregularly irregular rhythm (which is AFib) — we need to be certain we are seeing multiple different P wave morphologies that are constantly changing. Pearl #2 above describes how we are! 

  • PEARL #3: The diagnosis of MAT almost always occurs in one of 2 common predisposing settings. These 2 settings are: i) In patients with severe, often longstanding pulmonary disease; and/or, ii) In acutely ill patients with multi-system disease (ie, sepsis, shock, electrolyte and/or acid-base disorders). Awareness of this association is clinically important — because success in treating MAT depends on identifying and correcting this underlying cause!


What About the WIDE Beats?
It's time to address the remaining question about today's rhythm = What is the etiology of the widened beats?
  • PEARL #4: There is a phenomenon I've described as "Birds of a Feather". By this I mean that if there are multiple instances of an event in an arrhythmia (such as multiple early beats) — and we know that the overwhelming majority of these early beats are PACs, but we are uncertain about the etiology of a few widened early beats — "Think birds of a feather flock together" — such that rather than postulating an additional etiology for these few widened beats (such as PVCs) — it becomes likely that these unknown early beats are also PACs that are widened because of aberrant conduction (See Audio Pearl MP-67 below in the Addendum for more on the "Birds of a Feather" phenomenon).

There are a number of additional reasons why we know that the widened beats in today's tracing are aberrantly-conducted PACs (and not PVCs). These include:
  • The first wide beat in each of the 3 places where wide beats occur on the long lead rhythm strip is clearly preceded by a premature P wave (RED arrows before beats #2, 14 and 21 in Figure-2).
  • P waves also precede the other wide beats on this rhythm strip (PINK arrows before beats #3, 4, 5, 6 and 22).
  • Each of the widened beats in Figure-2 manifest a RBBB (Right Bundle Branch Block) morphology, with upright widened QRS in lead V1 and wide, terminal S wave in lateral lead I. The first wide beat in each grouping (ie, beats #2, 14 and 21) manifests the highly specific triphasic rsR' pattern that is so characteristic of aberrant conduction (See Video Pearl MP-28 below in the Addendum for full explanation why RBBB morphology is the most common pattern with aberrant conduction).
  • PEARL #5: The Ashman Phenomenon is present, and explains why beats #14, 21 and 22 conduct with RBBB aberration. As explained in detail in Audio Pearl MP-29 near the top of this page — the preceding R-R interval is proportional to the length of the subsequent relative refractory period. As a result — aberrantly-conducted beats often follow the longest pauses in a rhythm strip (ie, The longest pauses in Figure-2 = the R-R intervals between beats #12-13, and between beats #19-20).

  • Beyond-the-Core: Did YOU notice that in addition to the typical RBBB morphology for the widened beats — that a typical hemiblock morphology is also present for most of the widened beats? Specifically — the deep S wave descent in lead I for beats #3, 4, 5 and 6 is characteristic of LPHB (Left Posterior HemiBlock) conduction — and predominant negativity of the QRS in lead II for beats #14 and 21 is characteristic of LAHB (Left Anterior HemiBlock) conduction. The presence of this alternating typical pattern of bifascicular block conduction (RBBB/LPHB and RBBB/LAHB) provides yet one more finding in strong support of aberrant conduction. 

Figure-2: I have labeled P waves before each of the widened beats in Figure-1 (See text).


FOLLOW-UP to this Case:
It turns out that the patient in today's case was hypokalemic — and, had bilateral pleural effusions, requiring oxygen therapy. Although I lack additional follow-up — this information tells us that other factors were present that may have accounted for her irregular rhythm.
  • As emphasized above in Pearl #3 — the success in treating MAT depends on identifying and correcting the underlying cause of this rhythm. Awareness that the elderly patient in today's case had both hypokalemia and hypoxemia explains why treatment with several antiarrhythmic agents failed to control her arrhythmia.
  • In addition to the underlying rhythm of MAT — the rapid succession of PACs at the beginning of this rhythm strip (ie, beats #1-thru-6) constitues a run of Atrial Tachycardia, in which beats #2-thru-6 are wide because of aberrant conduction. There is no evidence of VT on this tracing. Hopefully, correction of the electrolyte disturbance and the patient's hypoxemia will help to resolve both the MAT and the runs of Atrial Tachycardia. 

=======================
Acknowledgment: My appreciation to Maurizio Collantoni (from Siena, Italy) for the case and this tracing.
=======================


=============================
Relevant LINKS to Today's Case:
=============================

Additional Relevant Material to Today's Case:
  • See ECG Blog #185 — for review of the Systematic Ps, Qs, 3R Approach to rhythm interpretation.

  • See ECG Blog #70 — for Review of the Ashman Phenomenon.
  • See ECG Blog #71 — for Review of why the Ashman Phenomenon may be less reliable with AFib (also reviews typical RBBB aberrancy morphology).

  • See ECG Blog #212 — for Step-by-Step discussion of another case with the Ashman Phenomenon.

  • See ECG Blog #211 — Reviews WHY some early beats and some SVT rhythms are conducted with Aberration (and why the most common form of aberrant conduction manifests RBBB morphology).

  • See ECG Blog #65 — for Review of MAT (and how this rhythm has similar clinical implications as for sinus rhythm with multiple PACs).
  • See ECG Blog #199 — for a thorough Review of MAT (with brief Video Pearl to facilitate recognition of this entity).

  • See ECG Blog #253 — Reviews a case with multiple aberrantly-conducted beats.

Relevant ECG Blog Posts to Today’s Case:

  • ECG Blog #140 — Example of alternating Bifascicular Block Aberration.
  • ECG Blog #14 — Example of Blocked PACs.
  • ECG Blog #15 — Example of a WCT due to Aberrant Conduction.
  • ECG Blog #33 — Example of PACs with varying degrees of Aberrant Conduction.
  • mm
  • ECG Blog #155 — What is a Wandering Pacemaker?
  • ECG Blog #200 — More on a Wandering Pacemaker (including brief Audio Pearl on this topic).

===================================
ADDENDUM (3/3/2022):
I've presented this material before — but it bears repeating for reference. These concepts should be automatic for assessment of irregular supraventricular rhythms, especially when there is suspected aberrant conduction.


Today’s ECG Media PEARL #28 (4:45 minutes Video) — Reviews WHY some early beats and some SVT rhythms are conducted with Aberration (and why the most common form of aberrant conduction manifests RBBB morphology).

  • NOTE #3: I have excerpted a 6-page written summary regarding Aberrant Conduction from my ACLS-2013-ePub. This appears below in the Addendum (in Figures-4, -5, and -6).
  • CLICK HERE — to download a PDF of this 6-page file on Aberrant Conduction.

=======================================


Today's ECG Media PEARL #67 (9:10 minutes Audio) — Applies the wisdom from 2 of my favorite sayings to the "art" of ECG interpretation. These 2 sayings are = "Birds of a Feather" and "Forest from Trees".

  • See ECG Blog #253 — for review of a case illustrating application of the "Birds of a Feather" principle.


=================================

For a Summary of KEY points related to MAT:

Figure-3: Summary of KEY points related to MAT.


=================================

In the following 3 Figures — I post written summary from my ACLS-2013-ePub regarding the basics of Aberrant Conduction.

  • CLICK HERE — for a PDF of this 6-page file on the basics of Aberrant Conduction that appears in Figures-4, -5, -6.


Figure-4: Aberrant Conduction — Refractory periods/Coupling intervals (from my ACLS-2013-ePub).


Figure-5: Aberrant Conduction (Continued) — QRS morphology/Rabbit Ears.


Figure-6: Aberrant Conduction (Continued) — Example/Summary.