Tuesday, February 8, 2022

ECG Blog #282 — LBBB and Sgarbossa? LVH? MI?


The ECG shown in Figure-1 is from a 48-year old man who presented with acute dyspnea.
  • How would YOU interpret this tracing?
  • Has there been an MI? (Are Sgarbossa criteria met?). 
  • Is there LVH? (Can you tell with the wide QRS?).
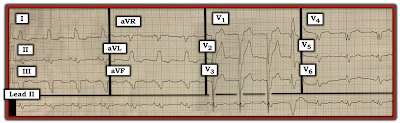
Figure-1: 12-lead ECG and long lead II rhythm strip from a 48-year old man with dyspnea.


=======================================

NOTE #1: Some readers may prefer at this point to watch the 13-minute ECG Video PEARL before reading My Thoughts regarding the ECG in Figure-1. Feel free at any time to review to My Thoughts on this tracing (that appear below ECG MP-22).

=======================================


Today's ECG Media Pearl #22 (13:15 minutes Video) — Reviews a user-friendly approach that allows diagnosis of the Bundle Branch Blocks in less than 5 seconds. 

=======================================

  • CLICK HERE — for FREE download PDF of this 26-page file on BBB (from my ECG-2014-ePub) — with review on the Basics for ECG diagnosis of the Bundle Branch Blocks (including diagnosis of acute MI & LVH with BBB).

=======================================


My Thoughts on the ECG in Figure-1:

As always — I favor beginning assessment by looking first at the cardiac rhythm. For clarity — I’ve numbered the beats and labeled P waves in the long lead II rhythm strip (Figure-2):

  • The overall rhythm in Figure-2 is fairly (albeit not completely) regular — with upright P waves having a constant (and normal) PR interval in this lead II rhythm strip (RED arrows). Therefore — the underlying rhythm is sinus at a rate of ~85/minute.
  • Beat #11 is wide, of a very different morphology, and occurs early. This beat is not preceded by any P wave. Beat #11 is a PVC (Premature Ventricular Contraction).


PEARL #1: Did YOU notice that there is no P wave before beat #12? 

  • Since QRS morphology of beat #12 is identical to the QRS morphology of other sinus beats in this long lead II rhythm strip — this defines beat #12 as a junctional beat. Normal sinus rhythm then resumes with beat #13.
  • NOTE: I fully acknowledge that the fact that beat #12 is a junctional (and not a sinus) beat — does not impact at all on the management of this patient. My point is simply to emphasize that the BEST way not to overlook subtle abnormalities in the cardiac rhythm is to routinely spend the first 3-to-5 seconds of your assessment carefully surveying each beat in the long lead rhythm strip. All it takes is a 3-to-5 second look — going beat-to-beat in the long lead II rhythm strip, assessing atrial activity. In my experience — providers who fail to do this commonly miss abnormal findings in the rhythm that sometimes do make a definite difference in the management process.

Figure-2: I've numbered the beats and labeled P waves from Figure-1.


Continuing with My Systematic Approach:
After assessment of Rate and Rhythm — I favor looking next at Intervals:
  • As already noted — the PR interval is constant in front of the sinus beats, and normal in duration (I measure ~0.16 second).
  • The QRS complex is wide (ie, clearly more than half a large box in duration). Interval duration is determined by selecting that lead in which the onset and offset of the interval can be clearly seen — and in which the interval is largest. I measure QRS duration to be ~3.5 little boxes in several of the chest leads = at least 0.14 second.

PEARL #2: There are many different "systems" for the interpretation of a 12-lead ECG. That said — Regardless of which system you prefer (be it mine or any other) — it is essential to look at Intervals at an early point in the process! The reason for this — is that criteria for Axis, Chamber Enlargement and Ischemia/Infarction all change when the QRS complex is widened by BBB (Bundle Branch Block) or IVCD (IntraVentricular Conduction Defect). 
  • First establish that your patient is hemodynamically stable, and not in VT (Ventricular Tachycardia). After doing so — IF the rhythm is supraventricular, but the QRS complex is wide (as it is in Figure-2) — then STOP! Before going further — Determine WHY the QRS complex is wide!

  • In today's ECG Video Pearl (ECG-MP-22 — above) — I review my user-friendly approach for determining the reason for the conduction defect, be this RBBB (Right Bundle Branch Block) — LBBB (Left Bundle Branch Block) — or IVCD. With a little practice — You can determine if the conduction defect is RBBB, LBBB or IVCD in less than 5 seconds!

  • NOTE: In addition to today's 13-minute ECG Video — this user-friendly approach to the BBBs is reviewed in this PDF File download (excerpted from my ECG-2014-ePub).


TAKE ANOTHER LOOK at the 12-lead ECG in today's case (Figure-3):
  • We have already established that the underlying rhythm is sinus with a PVC and a junctional beat after the PVC — followed by resumption of sinus rhythm.
  • WHY is the QRS complex wide in Figure-3?
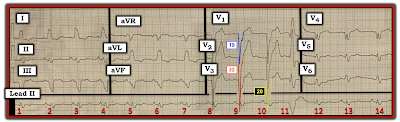
Figure-3: The 12-lead ECG and rhythm strip in today's case. What do the colored QRS complexes in leads V1, V2 and V3 tell us?


ANSWER:
The reason the QRS complex is wide in Figure-3 is that there is LBBB.
  • There is a monophasic R wave in left-sided leads I and aVL.
  • With typical LBBB — a similar all-upright R wave will usually also be seen in left-sided lead V6 — unless there is significant LVH (Left Ventricular Hypertrophy). As the left ventricle enlarges — the vector of left ventricular activity moves not only to the left, but also posteriorly. As a result — a monophasic R wave will sometimes not be seen with LBBB until more posteriorly-placed leads (such as V7, V8 or V9) are looked at. This is the case in today's tracing.
  • The other ECG criterion for LBBB (which is also satisfied in Figure-3) — is the presence of either all negative or almost all negative QRS complexes in the anterior leads.

PEARL #3: Almost all patients with LBBB have underlying heart disease. In such patients, if there is longerm hypertension, cardiomyopathy or heart failure and LBBB — the prevalence of LVH is at least 80% even before one looks at the ECG.
  • The probability that a patient with LBBB has LVH goes up to >90% — IF with LBBB there are very deep S waves (≥25-30 mm) in V1, V2 or V3. This is precisely what we see in today's tracing — in which the S waves in leads V1, V2 and V3 measure 19, 32 and 20 mm respectively (BLUE, RED and YELLOW-colored complexes in Figure-3).


QUESTION:
  • Has there been an MI? (Are Sgarbossa criteria met?).


ANSWER:
As emphasized above in today's ECG Video Pearl (ECG-MP-22), and in the accompanying PDF File download — the diagnosis of ischemia/infarction is always more challenging when there is underlying BBB.
  • For example — the ST-T wave depression seen in high-lateral leads I and aVL is to be expected with LBBB.
  • There is no primary ST elevation in today's tracing (as was seen for example, in ECG Blog #146 — and in Blog #162).


PEARL #4: In the absence of obvious acute ST-T wave changes in a patient with LBBB — use of Smith-Modified Sgarbossa Criteria may help to determine IF there is excessive discordance sufficient for diagnosis of probable acute coronary occlusion.
  • IF the J-point of the ST segment is up or down by ≥25% of QRS amplitude — then the criterion of excessive discordance is satisfied.
  • CAVEAT — It may be difficult to know where the J-point is, if anterior ST elevation with LBBB is of smooth contour (in which case you won't be able to use this criterion).
  • I've labeled today's tracing in Figure-4 — to illustrate application of Smith-Modified Sgarbossa Criteria. ST elevation is minimal in leads V1 and V3 of Figure-4. However, ST elevation is considerable in lead V2. The BLUE arrow in this figure indicates the change in slope that I take as the J-point in lead V2. The amount of J-point ST elevation is therefore 5 mm. Although lead overlap makes assessment of S wave depth difficult — the RED outline of the QRS complex in lead V2 shows the S wave to measure 32 mm. 

  • BOTTOM LINE: Although the amount of J-point ST elevation in lead V2 is considerable (ie, 5 mm) — because of marked LVH, the extremely deep S wave in this lead (of 32 mm) gives us a ratio of 5/32 — which is clearly less than 25%, such that Smith-Sgarbossa Criteria are not satisfied. 
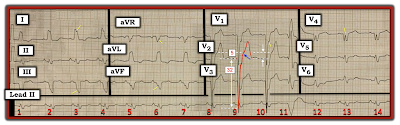
Figure-4 Application of Smith-Modified Sgarbossa Criteria.


PEARL #5: As discussed a number of times on this blog — the ECG finding of "Fragmentation" can be insightful (See ECG Blog #165). By "fragmentation" — I mean unexpected irregularities in QRS morphology, such as notching or slurring of waveforms (as highlighted by the short, slanted YELLOW lines in no less than 6 of the leads in Figure-4).
  • Fragmentation suggests scarring — that may be the result of prior infarction, cardiomyopathy, or some other form of structural heart disease.
  • Such fragmentation does not tell us whether heart disease is acute or has been present long-term — but it nonetheless is an invaluable clue for conveying that the patient in question almost certainly has some form of underlying structural heart disease.

Finally — the Q waves in leads V4 and V5 of Figure-4 are bizarre and unexpected. This clearly is not the usual appearance of typical LBBB — in which predominant negativity in the form of either QS or rS complexes without triphasic component are usually seen in chest leads until transition to predominant positivity occurs in the lateral chest leads.


CONCLUSION: The ECG in today's case shows sinus rhythm with a PVC. There is complete LBBB with marked LVH.
  • This patient almost certainly has severe underlying heart disease — as suggested by the combination of LBBB, marked LVH + fragmentation in multiple leads + bizarre triphasic QRS complexes in leads V4 and V5, that in the context of LBBB most probably represent Q-wave equivalents. The odds are high that there have been one or more prior infarctions.
  • Although nonspecific ST-T wave abnormalities are present in multiple leads — these most probably are the result of the conduction defect, LV "strain" and underlying coronary disease. While we can not rule out the possibility of some troponin rise — there is no definitive ECG evidence on this single tracing of acute coronary occlusion. Smith-Modified Sgarbossa Criteria are negative.

 
===============================
P.S. = ADDENDUM (3/9/2024):
Some 2 years after I initially posted this case in ECG Blog #282 — I have had occasion today to review what I wrote at that time. Looking at this case today — I would amend what I said in 2022 with the following:
  • The 48-year old man presented in Blog #282 had "acute dyspnea". Additional details from the history were not provided to me. I see no indication that a repeat ECG was done. In a patient with acute symptoms (ie, shortness of breath in this case) — until such time that you can confidently either rule in or rule out an acute event — one or more repeat ECGs should be obtained. This is because development of "dynamic" ECG changes in a patient with acute symptoms could be strong evidence in support that an acute event may indeed be evolving.
  • In an acute event — evolutionary ST-T wave changes sometimes develop quickly (ie, sometimes within minutes!). As a result — that 1st repeat tracing should be obtained within ~15-20 minutes, to see if there has been ST-T wave changes during that time. This apparently was not done in this case.
  • Comparison with a prior (baseline) ECG on the patient may have been insightful. This also apparently was not done.
  •  
  • Although primary ST elevation and Smith-Modified Sgarbossa Criteria are negative in today's case — ST-T wave appearance in leads V4,V5,V6 is not what one normally expects in association with LBBB because: i) In addition to the marked QRS fragmentation in lead V4 of Figure-1 — there is uncharacteristic ST segment straightening in this lead; and, ii) There is shelf-like ST segment straightening with slight depression in leads V5,V6.
  •  
  • To EMPHASIZE: While the above cited ST-T wave findings in leads V4,V5,V6 of Figure-1 are not diagnostic — they are not "normal" findings with LBBB. As a result — additional measures would be warranted to attain more certainty as to whether or not these ST-T wave findings that I am retrospectively noting, might have been indication of an acute event (ie, Several repeat ECGs looking for "dynamic" changes should have been done — search for a prior ECG on this patient to compare with this initial ECG — and serial troponins).

  • I wish I had more follow-up on this case ... 


=======================
Acknowledgment: My appreciation to Abdullah Al Mamum (from Dhaka, Bangladesh) for the case and this tracing.
=======================


=============================
Relevant LINKS to Today's Case:
=============================

Relevant ECG Blog Posts to Today’s Post: 

  • See ECG Blog #185 — for review of the Systematic Ps, Qs, 3R Approach to Rhythm Interpretation.

  • ECG Blog #205 — Reviews my Systematic Approach to 12-lead ECG Interpretation.
  • ECG Blog #93 — Reviews at a more basic level my approach to Systematic ECG Interpretation.

  • ECG Blog #198 — An Irregular WCT (LBBB or IVCD).
  • ECG Blog #162 — LBBB with obvious STEMI.
  • ECG Blog #146 — LBBB with Acute ST-T Wave Changes.
  • ECG Blog #204 — Assessment of Sinus Rhythm and a Wide QRS (due to IVCD).

  • ECG Blog #165 — How to "Date" an Infarction — Assessment for possible LV Aneurysm — and — the diagnostic value of recognizing "Fragmentation".

  • ECG Blog #145 — RBBB with Diffuse Subendocardial Ischemia.
  • ECG Blog #144 — AV Block and Alternating BBB.
  • ECG Blog #140 — Atrial Bigeminy with Alternating RBBB/LAHB-LPHB Aberration.
  • ECG Blog #135 — Regular WCT that Looks like Fascicular VT (but is Not!).
  • ECG Blog #130 — 2nd-Degree with Alternating BBB (LBBB-RBBB).
  • ECG Blog #122 — Bifascicular Block in a Child with Congenital Heart Disease.

  • The January 31, 2022 post in Dr. Smith's ECG Blog — Reviews subtle signs of acute OMI in a patient with LBBB (Please see My Comment at the bottom of the page).
  • The June 25, 2020 post in Dr. Smith’s ECG Blog — in which I review a case of Sinus Rhythm with Intermittent RBBB.

Friday, February 4, 2022

ECG Blog #281 (83) — Where are the P Waves?


The ECG shown in Figure-1 was obtained from a middle-aged woman being treated for an acute exacerbation of her asthma. This tachycardia developed after a series of nebulizer treatments. The patient was short of breath from her asthma — but hemodynamically stable.
  • What is the rhythm?
  • Where are the P waves? (Are P waves present before or after the QRS? — or are there no P waves at all?).

Figure-1: ECG obtained from a middle-aged woman being treated with nebulizers for an exacerbation of asthma.

=======================================

NOTE: Some readers may prefer at this point to listen to the 7:30 minute ECG Audio PEARL before reading My Thoughts regarding the ECG in Figure-1. Feel free at any time to refer to My Thoughts on this tracing (that appear below ECG MP-83).

=======================================

Today’s ECG Media PEARL #83 (7:30 minutes Audio) — Reviews the ECG finding of Electrical Alternans (See ECG Blog #83 — for more on this subject).


My Approach to Today's Case:
Since the patient was hemodynamically stable — there was time for systematic assessment of the rhythm. By the Ps, Qs, 3R Approach (See ECG Blog #185):
  • The rhythm is fast and Regular. I estimate the ventricular Rate to be ~160/minute (ie, the R-R interval is just under 2 large boxes in duration).
  • The QRS is narrow (ie, clearly not more than half a large box in duration) — which means that the rhythm is supraventricular.
  • Sinus P waves are absent — because there is no consistent upright deflection (P wave) before the QRS complex in lead II. Instead, it looks as there is negative atrial activity in at least a number of leads (BLUE arrows in each of the inferior leads in Figure-2). The timing of these negative inferior lead deflections corresponds to the positive pointed deflection (BLUE arrow) in lead aVR.

PEARL #1: The question arises as to whether the deflections highlighted by BLUE arrows in Figure-2 are truly P waves — and if so, whether these are retrograde P waves occurring after the QRS complex — or — negative P waves preceding the next QRS complex? All 3 of these possibilities should be considered. That said — reasons why I strongly suspected these deflections represented retrograde P waves with a long RP' interval (ie, long distance from the preceding QRS complex) were the following:
  • These deflections "look" much more like retrograde P waves. 
  • The deepest point of these deflections in the inferior leads (and the tallest point in lead aVR) are much more pointed than one usually sees in a T wave.
  • The PR interval if anything, shortens with tachycardia. IF these deflections were forward-conducting — then the PR interval would be longer-than-expected given the tachycardia.
  • IF the rhythm was an ectopic ATach (Atrial Tachycardia) — then we'd have to postulate a huge negative P wave! (which is possible, but less likely).
  • On the other hand — both the location of these deflections and their morphologic appearance is perfectly consistent with the "Fast-Slow" form of AVNRT (See Figures-5 and -6 in ECG Blog #240).
  • Further support in favor of this rhythm being a reentry SVT (in this case, of the "Fast-Slow" form of AVNRT) — is forthcoming from from the presence of Electrical Alternans in Figure-2 (best seen in lead V4 — in which QRS amplitude varies every-other-beat).


Figure-2: I've labeled with BLUE arrows the deflections from Figure-1 that I strongly suspect represent retrograde P waves with a long RP' interval (See text).


PEARL #2: The subject of today's Audio Pearl (ECG-MP-83 — See above) is Electrical Alternans — with more detailed discussion on this ECG phenomenon found in ECG Blog #83.
  • Although there are many potential causes of Electrical Alternans — when seen in a patient with a regular SVT rhythm, this ECG finding strongly suggests a reentry mechanism (either with participation of an Accessory Pathway — or with the reentry circuit entirely contained within the AV Node).
  • Although usually seen in several leads — Electrical Alternans may only be seen in a single lead. There should be no mistaking the every-other-beat alternation of QRS amplitude in lead V4 (Look within the YELLOW rectangle in Figure-3).
  • Alternation of one or more parts of the QRST complex is most often seen every-other-beat — but can occur at other frequencies. As a result — I interpreted the variation in QRS appearance that we see in the long lead II rhythm strip as also consistent with Electrical Alternans. This finding essentially rules out the possibility that the negative inferior lead deflections are forward-conducting P waves from an Atrial Tachycardia — because ATach is an "automatic" tachycardia, and not subject to AV nodal reentry (and therefore far less likely to produce Electrical Alternans).

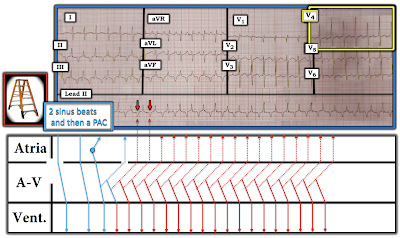
Figure-3: Laddergram illustration of the usual mechanism for the  "Fast-Slow" form of AVNRT that is operative in today's case. The phenomenon of Electrical Alternans is present, and best seen in lead V4 (within the YELLOW rectangle).


The Mechanism of the "Fast-Slow" Form of AVNRT:
The various types of reentry SVT rhythms were discussed and illustrated in ECG Blog #240. In brief — for those reentry SVT rhythms in which the reentry circuit is entirely contained within the AV Node (ie, AVNRT = AtrioVentricular Nodal Reentry Tachycardia) — most of the time, the electrical impulse travels first down the slower AV Nodal pathway — which means that the reentry circuit back to the atria is conducted over the faster AV Nodal pathway (ie, the much more common "Slow-Fast" form of AVNRT).
  • Since retrograde conduction back to the atria is over the "faster" AV Nodal pathway — this most common "Slow-Fast" form of AVNRT will manifest retrograde P waves with a very short RP' interval (in which the retrograde P wave will either be hidden within the QRS complex — or occur immediately after the QRS).
  • In contrast, with the far less common "Fast-Slow" form of AVNRT — retrograde conduction will be over the "slower" AV Nodal pathway — which will result in retrograde P waves with a much longer RP' interval (as seen in Figure-3 in today's case).

PEARL #3: The KEY clue for determining the etiology of an SVT rhythm often lies with capturing either the beginning and/or the end of the SVT rhythm.
  • ATach often begins gradually — with progressive acceleration of the ectopic atrial focus (ie, "warm-up" phenomenon). There may then be gradual slowing of the ectopic atrial focus (ie, "cool-down") as the tachycardia ends.
  • In contrast — SVT reentry rhythms often start with 1 or more PACs, that because of their early arrival at the AV node — encounter a block in conduction down one of the AV Nodal pathways that is still in its refractory state. This block in conduction down one of the AV Nodal pathways sets up the conditions that enable a reentry circuit to form, as the impulse is diverted and starts down the other pathway.
  • The onset of a reentry SVT is often abrupt (ie, accounting for the previous term used to designate this rhythm = PSVT = Paroxysmal SVT). The termination of reentry SVT rhythms is also usually quick (though termination may occur over a period of several beats).

The Laddergram in Figure-3:
We failed to capture the onset of the SVT rhythm in today's case. That said, for illustrative purposes — I've drawn in BLUE in the Figure-3 Laddergram the theoretical sequence of events that usually precedes (initiates) a reentry SVT rhythm.
  • For illustrative purposes — I began the laddergram in Figure-3 with 2 normal sinus beats (BLUE lines passing normally through the Atrial, AV Nodal and then Ventricular Tier).
  • After 2 normal sinus beats — I next drew a PAC (small BLUE circle with its origin in the middle of the Atrial Tier). This PAC conducts both back to the atria — and forward to the ventricles. 
  • IF conditions are "just right" — this PAC may find one of the AV Nodal pathways able to conduct retrograde back to the atrial (dotted BLUE lines).
  • IF conditions continue to be "just right" — the impulse from this retrograde conduction may "turn around" and conduct back down toward the ventricles. If these "just right" conditions are maintained — this may initiate a self-sustaining reentry circuit (schematically illustrated by solid and dotted RED lines for the rest of the tracing).
  • Depending on whether the PAC that initiated this reentry circuit traveled first down the "Fast" or the "Slow" AV Nodal pathway — will determine whether the mechanism of this AVNRT rhythm is of the more common "Slow-Fast" type — or the less common "Fast-Slow" type seen in today's case (and illustrated in this Figure-3 laddergram).


The CASE Continues:
The patient was treated with IV Verapamil. Serum K+ was found to be low — and was replaced. The 2 non-consecutive long lead II rhythm strips shown in Figure-4 show the result of this treatment.
  • Describe the effect of the above treatment.
  • Look again! What happens to the RP' interval during the course of treatment?

Figure-4: The 2 long lead II rhythm strips seen here (ie, Tracings A and B) — were obtained at 2 different points during the treatment process. What was the end result? Did you notice what happened to the RP' interval during the course of treatment?


ANSWER:
The end result of the above treatment was conversion to sinus rhythm — which occurred just after beat #10 in Tracing B. Of interest are the subtle changes that occur in the rhythm during the conversion process:
  • Although difficult to appreciate unless you measure with calipers — there is slight variation in the R-R interval in both tracings until conversion to sinus rhythm.
  • Attention to the T waves in both tracings until conversion to sinus rhythm — shows beat-to-beat variation in T wave morphology. I believe the reason for this is ongoing variation in the RP' interval produced by the IV Verapamil that is altering retrograde conduction properties within the AV Node.
  • Probably contributing to this beat-to-beat variation in QRST morphology is the phenomenon of Electrical Alternans.

A Final Laddergram:
Confirmation of AV Nodal reentry as the mechanism for the SVT in today's case is shown in Figure-5:
  • The first 9 beats in Tracing B show continuation of the reentry SVT rhythm — albeit with the slight variation in R-R interval plus the ongoing change in T wave morphology described above.
  • Note that there is no indication of any retrograde P wave following beat #10. This is shown schematically in the laddergram with a dotted line ending in a terminal butt end before making it through the Atrial Tier.
  • This failure to produce a retrograde P wave after beat #10 allows the SA Node a moment to recover — which results in conversion to sinus rhythm beginning with beat #11.

Figure-5: Laddergram of Tracing B from Figure-4. Beat #10 fails to conduct back to the atria (ie, no retrograde P wave after beat #10) — which allows the SA Node a moment to recover and regain control with resumption of sinus rhythm.


Final PEARL #4: While our goal is always to arrive at as precise of a rhythm diagnosis as possible — the "good news" regarding treatment of an undifferentiated regular SVT — is that for practical purposes, initial diagnostic and/or treatment measures in the field or in the ED are similar (ie, consideration of a vagal maneuver — and/or use of an AV nodal blocking agent such as Verapamil/Diltiazem; a ß-Blocker and/or Adenosine if available).
  • Most of the time — one or more of these initial treatment measures will either be successful — or — will allow a more definitive diagnosis to be made, that enables a more targeted treatment.
  • NOTE: Reentry SVT rhythms have a tendency to recur if conditions predisposing to their onset are not addressed. As a result — Be aware that there will often be a need to initiate longer-duration therapy after initial conversion to sinus rhythm (either by IV infusion or by addition of oral antiarrhythmic therapy).


=======================
Acknowledgment: My appreciation to Kenneth Khoo (from Malaysia) for the case and this tracing.
=======================


=============================
Relevant LINKS to Today's Case:
=============================

Additional Relevant Material to Today's Case:
  • See ECG Blog #185 — for review of the Systematic Ps, Qs, 3R Approach to rhythm interpretation.

  • See ECG Blog #83 — for more on Electrical Alternans.
  • See ECG Blog #263 — for another case of Electrical Alternans.

  • See ECG Blog #240 — for Review on the ECG assessment of the patient with a regular SVT rhythm (including distinction between the various types of SVT reentry).

How to Draw a Laddergram (Step-by-Step Demonstration) 
  • See ECG Blog #69 — for a Step-by-Step description on drawing a Laddergram.
  • See ECG Blog #188 — for a brief ECG Video review on the basics of what a Laddergram is — with LINKS at the bottom of the page to more than 50 ECG blog posts in which I review illustrative laddergrams.
  • See ECG Blog #164 — for a user-friendly rhythm-solving approach to AV Wenckebach, followed by Step-by-Step construction of the Laddergram.
  • CLICK HERE — to DOWNLOAD my Free PowerPoint Laddergram STENCIL for your use as desired.
===================================


ADDENDUM (2/6/2022):
I thought it important to add the comment I received from Nestor Rodrigues de Oliveira Neto regarding this case. Nestor wrote the following: 
  • "Another possibility here is Permanent Reciprocal Junctional Tachycardia (also known as Coumel Tachycardia) — which is a rare form of supraventricuar tachycardia that is usually incessant, and characterized by retrograde conduction via an AP (Accessory Pathway). Although more common in children and young adults — in cases of Coumel's Tachycardia, the P waves have a morphology similar to the one presented in today's ECG Blog #281.

My Answer:
  • Thank you Nestor. I completely agree with you! Here is a nice case study by Valiente et al (Anales de Pediatría 87(3): 173, 2017) — in which Figure-1 in their article looks virtually the same as Figure-1 in today's ECG Blog #281.

Tuesday, February 1, 2022

ECG Blog #280 (82) - Bigeminy/Random P Waves?


Today's CASE:
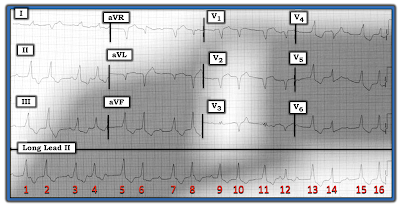
I was asked to interpret the ECG in Figure-1 — obtained from a 60-year old man with lung cancer. The patient had developed myocarditis as a complication of drug treatment for his disease. This was further complicated by recurrent VT.
  • Some time after the VT resolved — the ECG in Figure-1 was recorded. 

Figure-1: ECG from a 60-year old man with lung cancer, myocarditis — and a history of prior recurrent VT.


QUESTION: 
  • How would YOU interpret this ECG?


ANSWER:
I thought it might be most helpful to address today's case by means of an ECG Video, which I present below:
  • NOTE: This is a complex tracing — and — I fully acknowledge that I am not certain about all aspects of the ECG in Figure-1. That said — I thought this case makes for excellent illustration of the thought process for working through a complex arrhythmia. It also serves to illustrate how sometimes the use of a Laddergram can suggest the etiology for an arrhythmia that otherwise might have been insolvable if a ladergram had not been used.
  • To EMPHASIZE: I believe there is value in following this case regardless of how experienced you may or may not be with ECG interpretation. You do not have to know how to draw Laddergrams in order to be able to read them! This ECG Video will cover some important material for any level of interpreter.


ECG Media Pearl #82 (8:40 minutes Video) — Detailed analysis of this challenging arrhythmia (including ECG Video wth step-by-step analysis of my proposed Laddergram).
  • CLICK HERE to download a PDF of all tracings shown in today's ECG Video (including step-by-step construction of my proposed Laddergram).


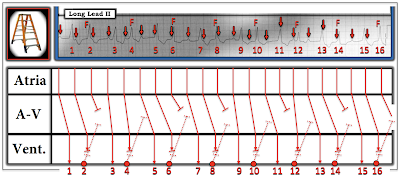
NOTE: Below in Figure-2 is my proposed Laddergram solution for today's case. I welcome input from readers — including additional proposed solutions for this case. To EMPHASIZE: This is not a simple case — and since I'm not certain of the full mechanism, my purpose in presenting this rhythm was not solely to find "the Answer". Instead — I'd be extremely happy if you:
  • Recognized the overall long-short "pattern" to the rhythm (ie, "group" beating).
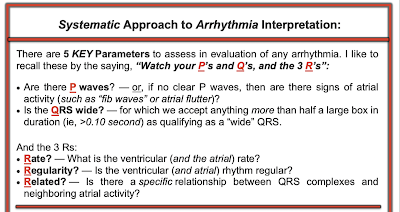
  • Appreciate the use of the Ps, Qs, 3R Approach (Figure-3).
  • See the importance of using all 12 leads of an ECG to help in determining the rhythm.
  • Appreciate that P waves may be "related" to neighboring QRS complexes (and therefore conducting) — even when the relationship is not overly evident.
  • Appreciate how a laddergram may suggest an etiology for a complex rhythm that otherwise might not be conceivable.


Figure-2: My proposed Laddergram for today's case. Full discussion of my rationale for derivation of this Laddergram is covered in the above ECG Video (ECG-MP-82).


Figure-3: The systematic Ps, Qs, 3R Approach for Rhythm Interpretation.


=======================
Acknowledgment: My appreciation to Antranik Ohanian (from Beirut, Lebanon) for the case and this tracing.
=======================


=============================
Relevant LINKS to Today's Case:
=============================

How to Draw a Laddergram (Step-by-Step Demonstration) 
  • See ECG Blog #69 — for a verbal Step-by-Step on drawing a Laddergram.
  • See ECG Blog #188 — for a brief ECG Video review on the basics of what a Laddergram is — with LINKS at the bottom of the page to more than 50 ECG blog posts in which I review illustrative laddergrams.
  • See ECG Blog #164 — for a user-friendly rhythm-solving approach to AV Wenckebach, followed by Step-by-Step construction of the Laddergram.
  • CLICK HERE — to DOWNLOAD my Free PowerPoint Laddergram STENCIL for your use as desired.

Additional Relevant Material to Today's Case:
  • See ECG Blog #185 — for review of the Systematic Ps, Qs, 3R Approach to rhythm interpretation.

  • See ECG Blog #128 — for review of the concept of Fusion Beats.
  • See ECG Blog #129 — for more on Fusion Beats (with laddergram illustration).

===================================