Thursday, July 8, 2021

ECG Blog #240 — What Kind of Regular SVT?


Today's blog is about assessing the regular SVT (SupraVentricular Tachycardia). The patient whose ECG is shown in Figure-1 presented with "palpitations". He was hemodynamically stable.

  • How would you interpret the ECG in Figure-1?
  • And — Can you tell the mechanism of this rhythm?
  • P.S. — How many of the PEARLS listed were new to you?


Figure-1: How would you interpret this ECG? (See text).


=======================================

NOTE: Some readers may prefer at this point to listen to the 4:20-minute ECG Audio PEARL before reading My Thoughts regarding the ECG in Figure-1. Feel free at any time to refer to My Thoughts on this tracing (that appear below ECG MP-55).

=======================================

Today's ECG Media PEARL #55 (4:20 minutes Audio) — What does the term, "SVT" mean? This Audio Pearl reviews the semantics and clinical application involved in use of this term. 


My Initial THOUGHTS on ECG #1:

As usual — I approach rhythm interpretation in systematic fashion by addresing the 5 KEY parameters contained in the Ps, Qs & 3Rs Approach (See ECG Blog # 185).

  • NOTE: There is no need to assess the 5 parameters in order (ie, I'll often look at QRS width or regularity of the rhythm before looking for P waves — depending on which of the 5 parameters is easiest to assess for the tracing at hand). 


My sequential thought process for the rhythm in Figure-1 was the following:

  • The QRS complex is narrow — so the rhythm is supraventricular.
  • Sinus P waves are absent (ie, there is no upright P wave in lead II — although, as will be discussed momentarily — it appears that there may be other signs of atrial activity).
  • The ventricular rhythm is Regular.
  • The R-R interval is just over 2 large boxes in duration — so the Rate of the rhythm is just under 150/minute.


IMPRESSION: The rhythm in Figure-1 is a regular SVT rhythm at ~140/minute — but without clear sign of sinus P waves.

  • Looking at the rest of the ECG — there is marked left axis deviation (consistent with LAHB) — no chamber enlargement — early transition (ie, R wave height already equals S wave depth as early as between lead V1-to-V2) — and — some nonspecific ST-T wave abnormalities (that may be rate-related — and which are probably not acute).


PEARL #1: Recognition that the rhythm in Figure-1 is a regular SVT — but without clear sign of sinus P waves (ie, without a definite upright P wave in lead II) — should prompt consideration of the followling differential diagnosis LIST:

  • i) Sinus Tachycardia (IF there is a possibility that sinus P waves might be hiding within the preceding ST-T wave); 
  • ii) A reentry SVT (either AVNRT if the reentry circuit is contained within the AV node — or AVRT if an AP [Accessory Pathway] located outside the AV node is involved); 
  • iii) Atrial Tachycardia (ATach);
  • iv) Atrial Flutter (AFlutter) with 2:1 AV conduction.


KEY Point: Although other entities may also produce a regular SVT (ie, sinoatrial node reentry tachycardia, junctional tachycardia) — they are far less common in practice. Therefore, remembering to think of the 4 entities in the above LIST whenever you encounter a regular SVT rhythm without clear sign of sinus P waves — will greatly facilitate determining the correct diagnosis.

  • NOTE: Most SVT rhythms manifest a narrow QRS complex. That said — an SVT rhythm may have a wide QRS if there is either preexisting bundle branch block or aberrant conduction due to the rapid rate.


PEARL #2: How Heart Rate helps in SVT Diagnosis:

  • Sinus Tachycardia usually does not exceed 160-170/minute in a "horizontal" adult (ie, in a patient you are examining, who has not just been running). This is not to say that sinus tachycardia will never go faster than 170/minute — but rather to suggest that when the rate of the regular SVT rhythm you are assessing is well over this rate range — then the rhythm will probably not be sinus tachycardia. NOTE: All bets are off in children — in whom sinus tachycardia over 200/minute is not that uncommon.
  • With AFlutter — the most common ventricular response in the patient who is not being treated with an antiarrhythmic medication is ~150/minute (usual range ~140-160/minute). This is because the atrial rate in untreated AFlutter is most often ~300/minute (usual range ~250-350/minute) — and since untreated AFlutter most often presents with 2:1 AV conduction — 300/2 ~150/minute. As a result — IF the ventricular rate of the regular SVT rhythm you are assessing is over ~170-180/minute — then AFlutter is less likely, because this rate would be faster-than-expected for 2:1 AV conduction, and too slow for 1:1 AV conduction. 
  • NOTE: This ~140-160/minute range is for untreated AFlutter. Patients who are already on antiarrhythmic medication may present with a slower atrial rate (and therefore slower ventricular response) for flutter.
  • It is well to remember that ATach is less common as a cause for a strictly regular SVT, especially in an otherwise healthy young-to-middle-aged adult. ATach is more likely to be seen in patients referred for EP (ElectroPhysiologic testing) — and in older adults with SSS (Sick Sinus Syndrome). I include ATach in the above differential diagnosis LIST for completeness — but take into account that it won't be seen as often as AFlutter and the reentry SVTs.
  • Therefore — IF the rate of a regular SVT without clear sign of sinus P waves is substantially faster than 160-170/minute — then a reentry SVT rhythm (ie, AVNRT or AVRT) becomes the most likely diagnosis. However, IF the rate of the regular SVT is close to 150/minute (ie, 140-160/minute) — then any of the 4 diagnostic entities in the above LIST could be present ( = sinus tach — AVNRT-AVRT — ATach — AFlutter).


PEARL #3: Other Helpful Diagnostic Features:

In addition to the ventricular rate of a regular SVT rhythm — there are a number of other ECG findings that may help with differential diagnosis. These include:

  • Detection of Atrial Activity! — I have reviewed on many occasions how using calipers can facilitate detection of 2:1 AV conduction diagnostic of AFlutter (ie, See my discussion in the November 12, 2019 post of Dr. Smith's ECG Blog). As I'll discuss momentarily — detection of retrograde atrial activity can be diagnostic of a reentry SVT rhythm.
  • Look for a “Break” (or subtle change) in the Rhythm! — Even a slight pause in the SVT rhythm, may be all that is needed to reveal underlying atrial activity that had been hidden by the regular tachycardia. 
  • Look for the “Onset” (and/or Termination) of the Rhythm! — The KEY clue to the etiology of an SVT often lies with capturing either the beginning and/or the end of the SVT. ATach often begins gradually, with progressive acceleration of the ectopic focus (ie, “warm-up” phenomenon). Then, there may be gradual slowing (ie, “cool-down”) of the rhythm as it ends. In contrast — SVT reentry rhythms often start with 1 or more PACs that block conduction down one of the AV nodal pathways, which serves to promptly set up the reentry circuit as the impulse starts down the other pathway. The onset of a reentry SVT is often abrupt (ie, accounting for the previous term used to designate this rhythm = PSVT = Paroxysmal SVT). The termination of reentry SVT rhythms is also usually quick (though this may occur over several beats).


PEARL #4: While our goal is to arrive at as precise of a rhythm diagnosis as possible — the "good news" is that for practical purposes — initial diagnostic and/or treatment measures in the field or in the ED for an undifferentiated regular SVT rhythm are similar (ie, consideration of a vagal maneuver — and/or use of an AV nodal blocking agent such as Verapamil/Diltiazem; a ß-Blocker, and possibly Adenosine).


========================== 

The CASE Continues:

Take another look at the rhythm in Figure-1.

  • QUESTION: Do you see any sign of atrial activity?


ANSWER:
We have emphasized how sinus P waves are not seen in Figure-1 — as there is no upright P wave that precedes the QRS complex in lead II.

  • That said — RED arrows in Figure-2 indicate that there are retrograde P waves! 


PEARL #5: Retrograde atrial activity is most easily recognized by the finding of negative P waves in one or more of the inferior leads. This negative P wave deflection may be seen as a notch in the terminal portion of the QRS complex — as a notch in the ST-T wave — or sometimes beyond the end of the T wave. 

  • In Figure-2 — retrograde atrial activity is best seen in leads III and aVF (as a negative notch) — and in lead V1 (as a small positive notch that appears just after the r' of the QRS complex). I suspect the negative deflection of the QRS in lead II reflects a combination of S wave + retrograde P wave, though it is more difficult to distinguish a distinct retrograde P wave in this lead.
  • KEY Point: The distance from the onset of the R wave until the beginning of the retrograde P wave — is known as the RP' interval.
  • IF retrograde P waves are seen in a regular SVT rhythm — and the RP' interval is short (ie, ≤70 msec.) — then AVNRT ( = AtrioVentricular Nodal Reentrant Tachycardia) is likely! (González-Torrecilla et al: Ann Noninvasive Electrocardiol 16(1):85-95, 2011).
  • Because precise measurement of the RP' interval is often difficult — I consider the RP' interval to be "short" (ie, predictive of AVNRT) — if retrograde P waves either notch the end of the QRS, or occur very soon after the QRS (as they do in Figure-2, as shown by the RED arrows).


Figure-2: I've added RED arrows to Figure-1 to indicate retrograde atrial activity. The RP' interval is short (ie, retrograde P waves immediately follow the end of the QRS complex) — therefore suggesting AVNRT as the mechanism for this SVT rhythm (See text).


Looking Closer at the Retrograde P Waves:
Consider the 3 tracings shown in Figure-3. They each show a regular SVT rhythm, in which sinus P waves (ie, upright P waves in lead II) are not clearly seen.

  • ECG #2 — shows a regular SVT at just under 150/minute. The upright deflection near the midpoint in the R-R interval in lead II is almost certainly just a T wave. Against there being a sinus P wave hidden within this T wave — is the fact that this would make the PR interval long (ie, ~0.26 second) — and if anything, the PR interval shortens when there is tachycardia. Although a rate of ~150/minute should always make you think about the possibility of AFlutter — other than possibly lead V6, none of the other 11 leads even remotely suggest 2:1 AV conduction. Instead — the RED arrows in ECG #2 suggest retrograde atrial conduction with a very short RP' interval that notches the terminal portion of the QRS complex (with a positive deflection in lead V1 — and — with suggestion of a negative notch in each of the inferior leads). This rhythm is unlikely to be ATach — because if that upright deflection in lead V1 was a forward-conducting P wave — it would make for an exceedingly long PR interval. This leaves us with a reentry SVT rhythm as the probable diagnosis for ECG #2 (ie, AVNRT or AVRT).
  • ECG #3 — shows a regular SVT at ~210/minute. For practical purposes, this rate is too fast to be Sinus Tachycardia. It is also too fast to be AFlutter with 2:1 AV conduction — since this would result in an atrial rate = 210 X 2 = 420/minute, which is much faster than the maximum atrial rate for flutter. AFlutter with 1:1 AV conduction is extremely uncommon, and a flutter rate of 210/minute would be uncharacteristically slow (unless the patient is on antiarrhythmic therapy). ATach is possible, but in the absence of clear sign of ectopic P waves — ATach is far less likely than a reentry SVT, which is a much more common rhythm (as per Pearl #2). While difficult to prove from this single tracing — I suspect that the RED arrows in ECG #3 (that highlight probable negative deflections in the inferior leads, with sharp angulation in lead V3) — represent retrograde atrial conduction with a moderately long RP' interval that occurs well after the QRS complex (within the latter part of the ST segment).
  • ECG #4 — shows a regular SVT at ~160/minute. There is a slow, gradual upslope to and beyond the ST segment, that leads up to a very deep, negative P wave (highlighted by RED arrows) in front of each of the inferior leads. This deflection before the QRS is positive in lead aVR. P wave negativity in the inferior leads rules out Sinus Tachycardia. Lack of 2:1 atrial activity rules out AFlutter. This essentially leaves us having to decide between ATach (in which case we'd have to postulate huge negative P waves) vs AVNRT, in which there is retrograde atrial conduction with a very long RP' interval.


Figure-3: For illustrative purposes — Consider the 3 regular SVT rhythms in this Figure. RED arrows represent retrograde atrial activity. (See text).

  
What the RP' Interval Tells Us in Figure-3:
The KEY to the probable etiology for each of the regular SVT rhythms shown in Figure-3 lies with he relative length of the RP' interval. 

  • ECG #2 in Figure-3 shows a very short RP’ interval, in which the retrograde P wave distorts the terminal portion of the QRS complex. This is virtually diagnostic of the "slow-fast" form of AVNRT — in which the impulse travels first down the "slow" AV nodal pathway — and back up the "fast" AV nodal pathway. It is because the impulse travels back up (ie, retrograde) over the “fast” AV nodal pathway that the RP’ interval is so short. This “slow-fast” form of AVNRT is by far the most common AVNRT form, so much so that we generally assume “slow-fast” conduction when we simply say “AVNRT”.
  • ECG #3 in Figure-3 shows a moderately long RP' interval. This suggests that there may be an AP (Accessory Pathway) participating in the reentry pathway — and that the type of reentry SVT is AVRT. Because the AP lies outside of the AV node with AVRT — the time to circulate around the reentry pathway and conduct back to the atria (retrograde) is longer than when the entire reentry circuit is contained within the AV node. As a result, the retrograde P wave will often be seen to occur within the ST segment, instead of notching the terminal portion of the QRS complex. A follow-up ECG was done on this patient, and did indeed show WPW (See My Comment in the October 16, 2019 post of Dr. Smith's ECG Blog).
  • ECG #4 in Figure-1 either shows a very long RP’ interval or an Atrial Tachycardia. Although definitive distinction between an ectopic ATach vs a reentrant SVT rhythm would require EP study — I favor the diagnosis of a reentrant SVT because: i) the shape of the ST segments in ECG #4, leading up to the large negative deflection highlighted by RED arrows looks more like retrograde activity; and, ii) If the rhythm was ectopic ATach, we'd have to postulate huge negative P waves! Therefore — IF we are indeed seeing a very long RP' interval in ECG #4 — then this would represent the far less common "fast-slow" form of AVNRT — in which the impulse travels first down the “fast” AV nodal pathway — and back up the “slow” AV nodal pathway. Retrograde conduction back up the “slow” AV nodal pathway would account for the very long RP’ interval.


PEARL #6: Note the PVC toward the end of the long lead II rhythm strip in ECG #4. This illustrates a concept mentioned in Pearl #3 — namely, that clues to etiology will often be found when there is a "break" in the underlying SVT rhythm.

  • Note that retrograde atrial activity from "fast-slow" AV nodal reentry continues unaffected by the PVC (vertical GREEN lines in Figure-3).
  • The finding of one or more PVCs during a reentrant SVT rhythm that do not convert the rhythm, favors AVNRT over orthodromic AVRT. This is because a premature impulse arising from the ventricles is much more likely to interrupt a reentrant SVT (such as AVRT) in which a part of the cycle passes through the ventricles (via an accessory pathway) on its way back to the AV node. 
  • In contrast — the reentrant cycle with AVNRT is entirely contained within the AV node, and therefore far less likely to be "penetrated" and interrupted by a PVC.
  • Bottom Line: While EP study would be needed for definitive diagnosis — I strongly suspect the "fast-slow" form of AVNRT for the etiology of the SVT rhythm in ECG #4 instead of AVRT or ectopic ATach.


Help from the Post-Conversion Tracing:

It's important to always repeat the ECG after conversion to sinus rhythm (Figure-4). This is because definitive determination of SVT etiology may only be possible after comparison of the ECG during and after the tachycadia.

  • PEARL #7: The BEST way to prove that suspicious deflections during the SVT rhythm were indeed reflective of retrograde atrial conduction — is to obtain a post-Conversion tracing. Note that retrograde atrial activity during the SVT (RED arrows in Figure-4) — is no longer present after conversion to sinus rhythm (BLUE arrows now showing smooth transition from the end of the QRS to the beginning of the ST segment). The only possible explanation is that the RED arrows represented retrograde P waves from a reentrant cycle with a very short RP' interval — such that the rhythm in ECG #2 was AVNRT.


Figure-4: Comparison of the SVT rhythm in ECG #2 with the post-Conversion tracing proves that the SVT rhythm was AVNRT (See text).


The Mechanism of the "Fast-Slow" form of AVNRT:

Finally — Consider the rhythm shown in Figure-5.

  • QUESTION: Can you explain what is happening in Figure-5?


Figure-5: A final example of a regular SVT rhythm. How does this SVT begin? (See text).


ANSWER:

The laddergram in Figure-6 reveals the mechanism operative for the SVT rhythm in ECG #5. This illustrates another concept mentioned in Pearl #3 — namely, that the onset and/or termination of the SVT rhythm may provide an invaluable clue to etiology.

  • Note that we see the onset of the tachycardia in Figure-6. After a sinus beat (ie, beat #3 in Figure-6) — a PAC (ie, beat #4) initiates the process.
  • This PAC presumably finds the slow AV nodal pathway amenable to retrograde conduction at the moment it is traveling toward the ventricles (ie, dotted, slanted lines in the AV Nodal Tier of Figure-6). IF the timing is “just right” (as shown in this laddergram) — then a reentry circuit utilizing the slow AV nodal pathway (which produces the very long RP’ interval) can be set up.
  • I’m uncertain why this “fast-slow” AVNRT terminates after beat #13 (perhaps because the R-R interval of beats #12-13 is a little bit shorter than preceding R-R intervals during the tachycardia?).
  • Following 1 sinus beat ( = beat #14) — it looks like the “fast-slow” AVNRT is about to begin again.


PEARL #8: ATach typically begins with gradual acceleration of an ectopic atrial focus (ie, "warm-up" phenomenon). It often terminates with gradual deceleration (ie, "cool-down" phenomenon). This is not what we see in Figure-6!

  • Reentrant SVT rhythms typically begin with one or more PACs, that serendipitously find one of the AV nodal pathways amenable to retrograde conduction. This serves to initiate the reentrant cycle.
  • There is no "warm-up" in Figure-6. After one retrograde beat — a constant reentrant R-R interval is set up for the 8 beats in the run of SVT that follows (ie, beats #6-thru-13).
  • There is no "cool-down". Instead — we see abrupt conversion to sinus rhythm with beat #14 (albeit the very next beat seems about to initiate another run).
  • A similarly abrupt termination (ie, without "cool-down") is observed at the beginning of ECG #5 (prompt cessation of SVT after beat #2).
  • Bottom Line: The sequence for "onset" and "offset" of the SVT rhythm in Figure-6 is typical for the uncommon "fast-slow" reentrant form of AVNRT.


Figure-6: Laddergram illustration of the mechanism for the SVT rhythm in Figure-5.


================================ 

Related ECG Blog Posts to Today’s Case: 

  • ECG Blog #185 — Reviews the Ps, Qs & 3Rs Approach to systematic rhythm interpretation.
  • ECG Blog #188 — Reviews the essentials for reading (and/or drawing) Laddergrams, with LINKS to numerous Laddergrams I’ve drawn and discussed in detail in other blog posts. 
  • ECG Blog #229 — Why is AFlutter so commonly overlooked? 
  • ECG Blog #137 — AFlutter with an unusual conduction ratio. 
  • ECG Blog #138 — AFlutter vs Atrial Tachycardia. 
  • ECG Blog #40 — Another regular SVT that turned out to be AFlutter.


Other sites where I've discussed some of the cases shown in today's blog:

  • The March 6, 2020 post in Dr. Smith's ECG Blog.
  • The October 31, 2016 post in Dr. Smith's ECG Blog.
  • The October 16, 2019 post in Dr. Smith's ECG Blog. 

  • Please check out the November 12, 2019 post in Dr. Smith's ECG Blog — in which I reviewed the case of a different kind of regular SVT Rhythm (AFlutter).


Sunday, July 4, 2021

ECG Blog #239 (54) — Why 2 Kinds of P Waves?


Today's case is a fascinating ECG, albeit without clinical information (Figure-1).

  • How would you interpret the ECG in Figure-1?
  • And — WHY are there 2 kinds of P waves? 


Figure-1: How would you interpret this 2-lead rhythm strip? (See text).


=======================================

NOTE: Some readers may prefer at this point to listen to the 5:00-minute ECG Audio PEARL before reading My Thoughts regarding the ECG in Figure-1. Feel free at any time to refer to My Thoughts on this tracing (that appear below ECG MP-54).

=======================================


Today's ECG Media PEARL #54 (5:00 minutes Audio) — Reviews what Echo Beats are — and clinical applications of this ECG finding.


My THOUGHTS on this Case:

As usual — I approach rhythm interpretation in systematic fashion by addresing the Ps, Qs & 3Rs (See ECG Blog #185). NOTE — It is not essential to perform this assessment in order (ie, I'll often look at QRS width or regularity of the rhythm before assessing atrial activity — depending on whatever is easiest to assess for the tracing at hand). For the rhythm in Figure-1 — My sequential thought process was as follows:

  • The QRS complex is narrow — so the rhythm is supraventricular.
  • Although at 1st glance, the rhythm in Figure-1 may appear regular — this rhythm is not regular! Instead, there is Group Beating, in the form of alternating longer and slightly shorter R-R intervals.
  • NOTE: To prove that the rhythm in Figure-1 truly represents group beating — Measure all R-R intervals! This is easiest to do with calipers. Doing so will establish that all of the "shorter" R-R intervals are the same duration ( = 800 msec) — and — all of the "longer" R-R intervals are the same duration ( = 830 msec), albeit slightly longer (ie, 830 vs 800 msec — as in Figure-2).


Figure-2: Measuring duration of each R-R interval in Figure-1 establishes group beating (See text).


PEARL #1: As we have often emphasized (See ECG Blog #186) — the finding of Group Beating provides an excellent clue to the likelihood that some form of Wenckebach conduction may be present!

  • NOTE: Not all group beating is the result of Wenckebach conduction. This is because other conditions (ie, atrial or ventricular bigeminy or trigeminy) may also produce a "regular irregularity" to the rhythm. That said — Recognition of group beating is helpful — because it immediately tells us to look closely for some form of Wenckebach conduction. 


Continuing with the Ps, Qs & 3Rs Approach:

  • P waves are present in Figure-2. However, there are 2 different P wave shapes! 


For clarity — we have labeled all of the P waves in today's tracing in Figure-3.

  • QUESTION: Why are there 2 kinds of P waves?


Figure-3: I've labeled all P waves in today's tracing with letters.


My THOUGHTS on Figure-3:

The 2 types of P waves seen in Figure-3 are an upright, m-shaped notched P wave in lead II ( = a, c, d, f, g, i, j, l, m) — and a shallow, negative P wave in lead II that occurs just after the QRS complex of beats #1, 3, 5, 7 and 9 ( = b, e, h, k, n).

  • Sinus P waves should be upright in lead II. This suggests that the upright, m-shaped notched P waves that we see in Figure-3 are sinus P waves.
  • When P waves are negative in lead II — this suggests either: i) That these negative P waves originate from lower down in the atria (or from the AV node); or, ii) That there is retrograde conduction.


PEARL #2: The sinus P waves that we see in Figure-3 appear to be conducting. We say this because there are 2 sets of repeating PR intervals!

  • The PR intervals preceding beats #2, 4, 6 and 8 are equal ( = 0.17 second).
  • The PR intervals preceding beats #1, 3, 5, 7 and 9 are also equal ( = 0.47 second).
  • It is highly unlikely that PR intervals that are precisely equal in so many places on the tracing are occurring by chance. Instead — it must be that these repeating PR intervals indicate that all of these beats are conducted!


We are left with determining the etiology of these negative P waves in Figure-3 (ie, b, e, h, k and n).

  • Against these P waves being retrograde from a junctional rhythm — is the finding of a fixed (albeit long) PR interval preceding beats #1, 3, 5, 7 and 9 (ie, beats #1, 3, 5, 7 and 9 are sinus-conducted and not junctional escape beats).
  • Against P waves b, e, h, k and n being blocked PACs — is the expectation that blocked PACs would "reset" the SA node, and produce a longer delay after beats #1, 3, 5, 7 and 9. Instead — the shortest R-R intervals in this tracing follow these negative P waves.
  • By the process of elimination — these negative P waves are most likely to represent Echo beats!


WHAT are Echo Beats?

On occasion, an atrial impulse that has already passed through the atria — may be conducted backward (ie, retrograde) — to return and reactivate the atria. This process produces an Echo beat. If the timing of the "echo" beat is just right — the impulse may also propagate downward to activate the ventricles.

  • PEARL #3: The principal factor that predisposes to development of Echo beats is delay in conduction through the AV node — as commonly occurs with Mobitz I 2nd-degree AV block (ie, AV Wenckebach). The reason for this is simple — the longer it takes for a P wave to get through the AV node — the more opportunity there is for retrograde conduction to occur.
  • Because an Echo beat is conducted backward (retrograde) to the atria — the P wave produced by this retrograde conduction will be negative in lead II.


PEARL #4: At times, it may be difficult to distinguish Echo beats from PACs — because both entities may produce a negative P wave in lead II.

  • BUT — IF negative P waves are only seen after lengthening of the preceding PR interval — this strongly suggests that these negative P waves are Echo beats (by the concept expressed in Pearl #3).


============================ 

A picture is worth 1,000 words!

  • Consider my proposed Laddergram in Figure-4.


Figure-4: My proposed laddergram to explain the mechanism of the rhythm in today's case (See text).


My THOUGHTS on Figure-4:

Confession: I was not comfortable with my assessment of today's rhythm until I was able to draw out a plausible explanation on a laddergram.

  • I strongly suspected some form of AV Wenckebach was operative in Figure-3 — because of group beating and the 2 repetitive PR intervals. But the fact that sinus P waves were not regular throughout the rhythm meant that something other than "simple" Mobitz I was at play.
  • IF the rhythm in Figure-3 was AV Wenckebach — then the PR interval increment (ie, the amount that the PR interval increases from 1 beat to the next) was much larger than usual (ie, the jump from a PR interval of 0.17 second to 0.47 second means that the PR increment = 0.30 second, which is extremely long!). Although not common — the presence of dual AV nodal pathways could account for this unexpectedly large PR interval increment.
  • The laddergram that I drew in Figure-4 is based on presuming that P waves b, e, h, k and n are Echo beats. This is a logical assumption — because these negative P waves in lead II only occur after PR interval lengthening of the preceding sinus-conducted beats (as per Pearls #3 and #4). 
  • In Figure-4 — The retrograde conduction back to the atria of these atrial echos (to produce negative P waves b, e, h, k and n in lead II) — is represented by dotted lines in the laddergram.


=============================

Final Interpretation of Figure-4:

My final interpretation of today's rhythm (as schematically represented in the Figure-4 laddergram) — is 2nd-Degree AV Block, Mobitz Type I, with Wenckebach cycles terminated by atrial Echo beats. Presumably, the marked PR interval increment is a result of conduction alternating between dual AV nodal pathways.

=============================


PEARL #5: Uncomplicated 2nd-degree AV block of the Mobitz I type is characterized by a regular (or almost regular) atrial rhythm — with progressive increase in the PR interval until a beat is dropped. That said, on occasion — AV Wenckebach cycles may be terminated by other ECG events that occur before the next on-time P wave can be discharged from the SA node. Examples of other phenomena that may terminate Wenckebach cycles include junctional escape beats — PACs — and — Echo beats.

  • This is precisely what happens in Figure-4! The atrial echo beats (ie, P waves b, e, h, k and n) arrive at the atria just before the next sinus P wave would occur. As a result — these atrial echos suppress the next sinus impulse — and in so doing, terminate each of the 2-beat Wenckebach cycles seen in this laddergram.


Why Else should we Care about Echo Beats?

Echo beats are not common in practice. That said, when they do occur — they may have important clinical implications. As a result — it is useful to be aware of this advanced arrhythmia concept. Consider Figure-5.

  • QUESTION: Can you explain what happens in Figure-5? 


Figure-5: Please NOTE that Figure-5 is not a real ECG. I took the first 5 beats from Figure-4 — and I made up the next 5 beats (ie, beats #6-thru-10), so as to simulate a potential complicating arrhythmia that might arise from the presence of Echo beats. Can you explain what happens after beat #5?


My THOUGHTS on Figure-5:

The first 5 beats in Figure-5 are identical to what we saw in the Figure-4 laddergram — namely Mobitz I (with a large PR interval increment) — that is then terminated by atrial echo beats b and d.

  • The 2-beat Wenckebach cycles continue with beats #4 and #5 — but this time, atrial echo h is able to conduct down to the ventricles! This initiates a reentrant SVT rhythm that continues at least until the end of the rhythm strip.
  • This theoretical laddergram in Figure-5 — illustrates how not only PACs may precipitate reentrant SVT rhythms (such as AVNRT, AVRT) — but, if conditions are "just right" — reentrant SVTs may also be initiated by Echo beats.


==================================

Acknowledgment: My appreciation Victor Svensson (from Växjö, Sweden) and Peter Hammarlund (from Helsingborg, Sweden) for making me aware of this case and allowing me to use this tracing.

==================================


Related ECG Blog Posts to Today’s Case: 

  • ECG Blog #185 — Reviews the Ps, Qs & 3Rs Approach to systematic rhythm interpretation.
  • ECG Blog #186 — Highlights the importance of Group Beating — and reviews when to suspect the Mobitz I form of 2nd-Degree AV Block ( = AV Wenckebach). 
  • ECG Blog #188 — Reviews the essentials for reading (and/or drawing) Laddergrams, with LINKS to numerous Laddergrams I’ve drawn and discussed in detail in other blog posts.


Thursday, July 1, 2021

ECG Blog #238 (53) — What is Phenocopy?


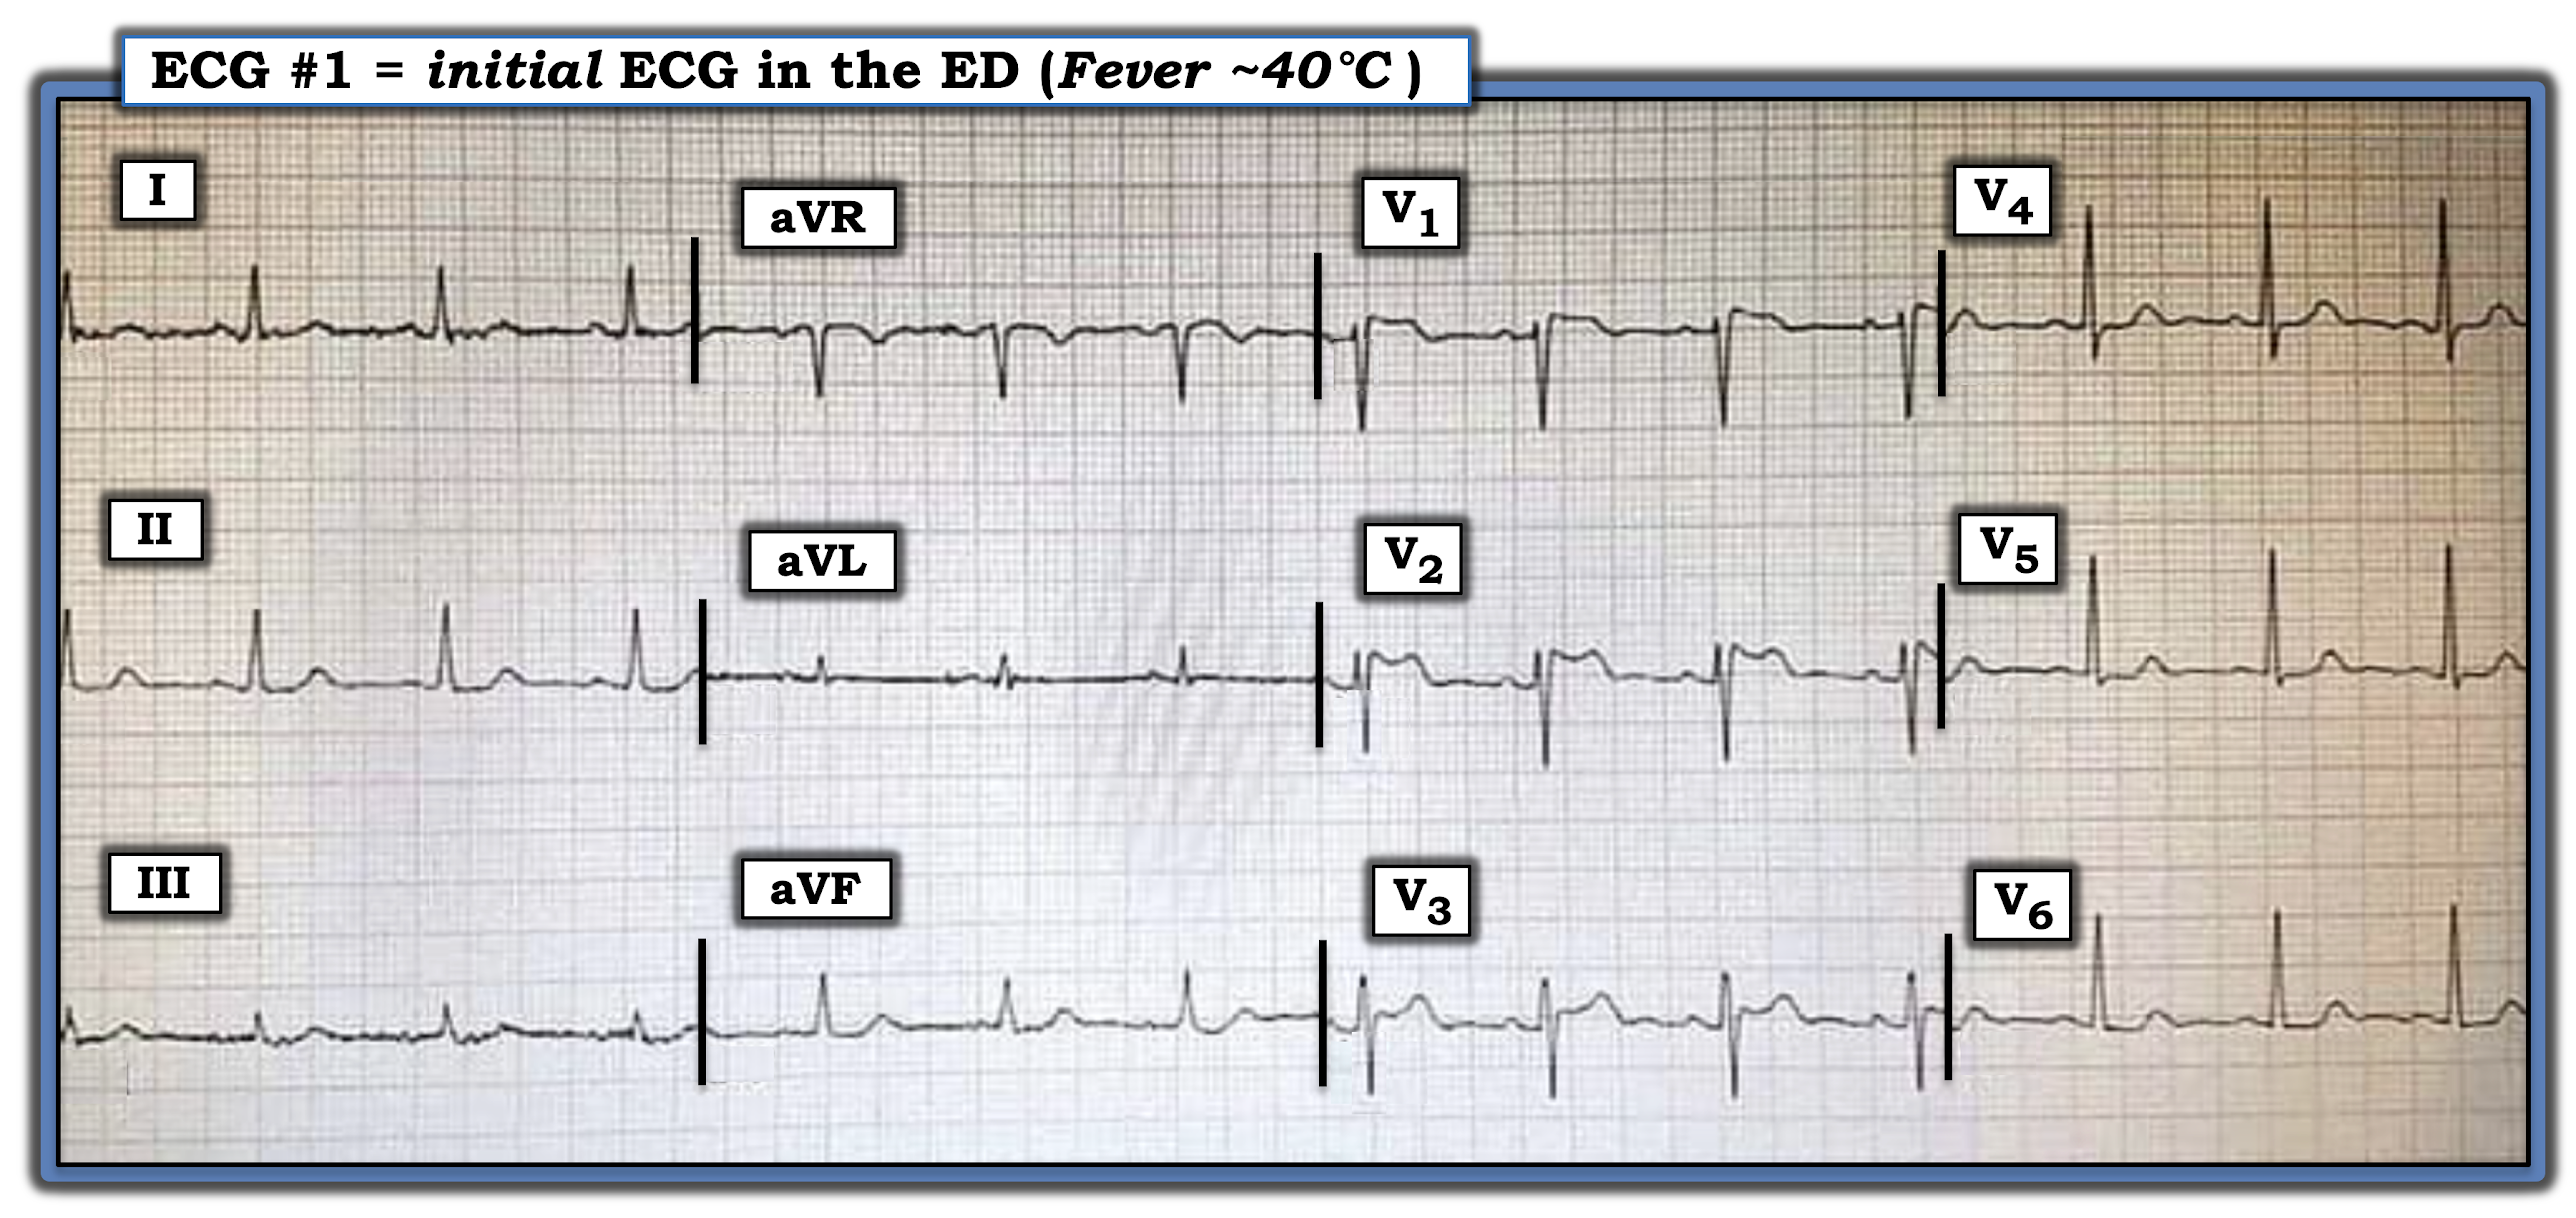
The ECG shown in Figure-1 was obtained from an elderly woman, who presented to the ED (Emergency Department) with an acute febrile illness (40°C).

  • How would you interpret her initial ECG?
  • Clinically — Could this be an early acute antero-septal STEMI?


Figure-1: ECG obtained from an elderly woman with an acute febrile illness (See text).


The Case Continues:

The ECG was repeated (Figure-2) — this time with anterior leads placed 1 interspace higher.


Figure-2: Repeat ECG of the tracing shown in Figure-1, with anterior leads placed 1 interspace higher (See text).


QUESTION:

  • Do these serial tracings suggest an acute evolving anterior STEMI?


=======================================

NOTE: Some readers may prefer at this point to refer to ECG Media PEARL #53 before reading My Thoughts regarding the ECGs in Figure-2. This 2-part ECG Video (9 minutes and 8 minutes) — reviews the ECG recognition and clinical significance of Brugada-1 and Brugada-2 ECG patterns + it clarifies the concept of Brugada Phenocopy.

  • For an excellent state-of-the-art Review article on Brugada Syndrome — CLICK HERE (Brugada J et al: J Am Coll Cardiol 72(9) 1046-1059, 2018).
  • For a Review on the entity of Brugada Phenocopy — CLICK HERE (Anselm D et al: World  Cardiol 6(3) 81-86-2014).
  • For a study documenting the inability of experts to distinguish between a Brugada-1 ECG pattern from Brugada Syndrome vs Brugada Phenocopy — CLICK HERE (Gottschalk et al: Europace 18, 1095-1100, 2016).
  • For brief summary of this material — Please refer to Figures-5, -6 and -7 in the Addendum below.

=======================================


In Part 1 of today's ECG Media Pearl #53 (9:00 minutes Video) — the essentials of Brugada Syndrome are reviewed.


Int Part 2 of today's ECG Media Pearl #53 (8:00 minutes Video) — these essentials are applied clinically. 

=======================================

My THOUGHTS on this Case:

Looking first at the ECG in Figure-1 — The rhythm is sinus — all intervals (PR, QRS, QTc) and the axis are normal — and there is no chamber enlargement.


Regarding Q-R-S-T Changes in Figure-1:

  • There are no Q waves.
  • R Wave Progression is normal, with transition (where the R wave becomes taller than the S wave is deep) occurring normally between leads V3-to-V4.
  • Regarding ST segments and T waves — the most striking abnormality is the ST elevation in leads V1, V2 and V3, with "double-hump" upward concavity in lead V3.
  • ST segments are noticeably flattened in several limb leads — as well as in lateral chest leads (that also show slight ST depression).


My Impression of ECG #1: There is no denying the presence of anterior ST elevation with ST segment flattening and slight ST depression in other leads.

  • That said — Against these ST-T wave changes in ECG #1 representing an acute cardiac event — is the clinical history of acute febrile illness in this elderly woman, with no mention in the history of associated chest pain.


QUESTION:

What happened in ECG #2 (bottom tracing in Figure-2)?


ANSWER:

The main difference between ECG #1 and ECG #2 is the appearance of the ST-T waves in leads V1, V2 and V3:

  • The R' peak in leads V1 and V2 is higher in ECG #2, with sharp downsloping that leads into a more noticeably inverted T wave.
  • The "double-hump" upward ST segment concavity that was seen in lead V2 of ECG #1 — is now seen in lead V3 of ECG #2.


My Impression of ECG #2: The ECG picture in Figure-2 stongly suggests we are seeing Brugada ECG patterns.

  • The "double-hump" upward ST segment concavity in lead V2 of ECG #1 — is consistent with a Brugada-2 (ie, "Saddleback" ) pattern.
  • The higher-rising, steeper downsloping ST-T wave appearance in leads V1 and V2 of ECG #2 — now meets criteria for a Brugada-1 ECG pattern, with a Brugada-2 pattern now seen in lead V3.
  • In view of the clinical history — this is unlikely to represent an acute anteroseptal STEMI.


PEARL #1: It turns out that ECG #2 was repeated soon after ECG #1. This illustrates how the simple measure of placing anterior leads 1 or 2 interspaces higher on the chest may serve to bring out a Brugada ECG pattern!


The Case Continues:

The patient was treated for her acute febrile illness. Her ECG was repeated after her fever had resolved (Figure-3).


Figure-3: Repeat ECG following resolution of this patient's fever — compared to the initial ECG in this case (See text).


QUESTION:

Does the patient in today's case have Brugada Syndrome?


WHAT is Brugada Syndrome?

First described in 1992 — the Brugada Syndrome is important to recognize because of an associated very high risk of sudden death in otherwise healthy young or middle-aged adults who have structurally normal hearts.

  • The prevalence of Brugada Syndrome in the general population is ~1/2,000. The syndrome has become a leading cause of sudden death in young adults (under 40 years of age).
  • PEARL #2: Brugada Syndrome is much more common in Southeast Asia compared to the rest of the world. When considering the possibility of this syndrome — demographics of the patient are important! (See Figure-6 in the Addendum below).
  • PEARL #3: Although the genetics of Brugada Syndrome are complicated — the gender of the patient is also important. There is a distinct male predominance to this syndrome.


Personal Reflection: I never learned about Brugada Syndrome in medical school (the syndrome had not yet been described). But especially during the past 10 years, in which I've closely followed numerous international ECG internet forums — I've seen countless cases, especially of transient Brugada ECG patterns similar to today's case. 

  • Once a clinical entity is "discovered" — it begins to get noticed with increasing frequency.


Regarding BRUGADA Syndrome vs Phenocopy: 

I reference an excellent state-of-the-art Review article on Brugada Syndrome (Brugada J et al: J Am Coll Cardiol 72(9) 1046-1059, 2018). I've synthesized key aspects of this article:

  • A Brugada Type-1 ECG pattern is diagnosed by the finding of ST elevation of ≥2 mm in one or more of the right precordial leads (ie, V1, V2, V3) — followed by an r’ wave and a coved or straight ST segment — in which the ST segment crosses the isoelectric line and ends in a negative T wave (See Panel A in Figure-4).
  • A Brugada-1 pattern may either be observed spontaneously (with leads V1 and/or V2 positioned normally — or — positioned 1 or 2 interspaces higher than usual) — or — a Brugada-1 pattern may be observed as a response to provocative drug testing after IV administration of a sodium-channel blocking agent such as ajmaline, flecainide or procainamide.
  • NOTE: In the past, the diagnosis of Brugada Syndrome required not only the presence of a Brugada-1 ECG pattern — but also a history of sudden death, sustained VT, non-vasovagal syncope or a positive family history of sudden death at an early age. This definition was changed following an expert consensus panel in 2013 — so that at the present time, all that is needed to diagnose Brugada Syndrome is a spontaneous or induced Brugada-1 ECG pattern (without need for additional criteria).
  • Panel B in Figure-2 illustrates the Brugada Type-2 or "Saddleback" ECG pattern. This pattern may be suggestive — but by itself, it is not diagnostic of Brugada Syndrome (See Figure-4).


Figure-4: Review of ECG Patterns in Brugada Syndrome (adapted from the above cited article by Brugada et al in JACC: Vol 72, Issue 9) — (A) Brugada-1 ECG pattern, showing coved ST-segment elevation ≥2 mm in ≥1 right precordial lead, followed by a negative T-wave. (B) Brugada-2 ECG pattern (the “Saddleback” pattern) — showing concave-up ST-segment elevation ≥0.5 mm (generally ≥2 mm) in ≥1 right precordial lead, followed by a positive T-wave. (C) Additional criteria for diagnosis of a Brugada-2 ECG pattern (TOP: the ß-angle; BOTTOM: A Brugada-2 pattern is present if 5 mm down from the maximum R’ rise point — the base of the triangle formed is ≥4 mm — as this ensures a ß-angle ≥58°).


PEARL #4: A number of conditions other than Brugada Syndrome may temporarily produce a Brugada-1 ECG pattern. A partial list includes the following:

  • Certain drugs (antiarrhythmics; calcium channel blockers; ß-blockers; antianginals; psychotropic medications; alcohol; cocaine; other drugs).
  • Acute febrile illness.
  • Variations in autonomic tone.
  • Hypothermia.
  • Electrolyte imbalance (hypokalemia; hyperkalemia).
  • Ischemia/infarction.
  • Cardioversion/defibrillation.
  • Bradycardia.


KEY Point: Development of a Brugada-1 or Brugada-2 ECG pattern as a result of one or more of the above factors — with resolution of this Brugada ECG pattern after correction of the precipitating factor(s) is known as Brugada Phenocopy.

  • The importance of being aware of this phenomenon of Brugada Phenocopy — is that correction of the underlying condition (ie, the acute febrile illness in today’s case) may result in resolution of the Brugada-1 ECG pattern — with a much better longterm prognosis compared to patients with true Brugada Syndrome (ie, an ICD may not be needed, as it probably would be if true Brugada Syndrome was present!).
  • NOTE: To ensure a diagnosis of Brugada Phenocopy — the patient should have: i) A negative family history of sudden death; ii) Lack of a Brugada-1 ECG pattern in 1st-degree relatives; iii) No history of syncope, serous arrhythmias, seizures or nocturnal agonal respiration; and, iv) A negative sodium channel-blocker challenge test.


==================================

Final Comment on Today's Case:

Assuming the elderly woman in today's case had otherwise been healthy (without a personal history of syncope, serious arrhythmias, seizures or nocturnal agonal respiration) — the fact that the Brugada-1 ECG pattern we initially saw completely resolved so soon after fever resolution, strongly suggests she has Brugada Phenocopy (and not Brugada Syndrome) — and that her longterm prognosis is likely to be good.

  • Whether she needs to undergo a negative sodium channel-blocker challenge test at her advanced age (and what impact her family history might have at her age) — are issues for her informed consent and medical providers to decide.


==================================

Acknowledgment: My appreciation to 유영준 (from Seoul, Korea) for making me aware of this case and allowing me to use this tracing.

==================================


References & Related ECG Blog Posts to Today’s Case: 

  • For an excellent state-of-the-art Review article on Brugada Syndrome — CLICK HERE (Brugada J et al: J Am Coll Cardiol 72(9) 1046-1059, 2018). 
  • For a Review on the entity of Brugada Phenocopy — CLICK HERE (Anselm D et al: World  Cardiol 6(3) 81-86-2014).
  • For a study documenting the inability of experts to distinguish between a Brugada-1 ECG pattern from Brugada Syndrome vs Brugada Phenocopy — CLICK HERE (Gottschalk et al: Europace 18, 1095-1100, 2016).

  • ECG Blog #50 — For a case of Brugada Syndrome.

  • The September 5, 2020 post in Dr. Smith's ECG Blog (Please scroll down to the bottom of the page to see My Comment). This case shows an example of Brugada Phenocopy as a result of Hyperkalemia. 
  • The May 6, 2019 post in Dr. Smith's ECG Blog (Please scroll down to the bottom of the page to seeMy Comment). This case reviews an example in which it was difficult to distinguish between Brugada Phenocopy vs an ongoing acute STEMI. 
  • The September 8, 2019 post in Dr. Smith's ECG Blog (Please scroll down to the bottom of the page to see My Comment). This case reviews another example of Brugada Phenocopy as a result of Hyperkalemia.


==================================

ADDENDUM (7/1/2021): Summarizing material on Brugada Syndrome:


Figure-5: 2-page Summary of the essentials of Brugada Syndrome (from my ECG-2014-ePub).


Figure-6: World prevalence map of Brugada Syndrome. The overall worldwide prevalence of Brugada Syndrome is ~0.5/1,000 in the population. This prevalence is highest in Southeast Asia (at least 5 times more common than in North America). The country with highest prevalence of Brugada Syndrome is Thailand, with ~15 times higher prevalence thn the worldwide average. Brugada-2 patterns (ie, "Saddleback") are also much more prevalent in Southeast Asia than elsewhere in the world. (Excerpted from Vutthikraivit et al: Acta Cardiol Sin 34:267-277, 2018).


Figure-7: Summarizing Figure of KEY concepts reviewed in the above ECG Videos (ECG MP-53).