Thursday, April 8, 2021

ECG Blog #212 (ECG MP-29) — Why So Many QRS Shapes? Is this Ashman?


The 2 lead MCL-1 rhythm strips shown in Figure-1 were obtained from a middle-aged adult who was hemodynamically stable at the time these tracings were recorded. Tracing B was obtained just minutes after Tracing A.


QUESTION: WHICH of the following statements are TRUE regarding the multiple different QRS shapes seen in these 2 rhythm strips?

— a) It is likely that all beats on these 2 tracings are supraventricular.

— b) There are multiple PACs, and probably also some AFib.

— c) The Ashman Phenomenon is present.

— d) There is RBBB aberration.

— e) Beats #13-thru-16 probably represent a 4-beat run of NSVT (Non-Sustained Ventricular Tachycardia).

— f) Once the heart rate slows — it is likely that all QRS complexes will look the same.


Figure-1: Tracings A and B were obtained minutes apart from a hemodynamically stable, middle-aged adult. HOW do you interpret these rhythms? (See text).


  • NOTE #1: Lead MCL-1 is a right-sided monitoring lead that provides a similar perspective as is seen in lead V1 on a 12-lead tracing. And, although ideally, we would have a complete 12-lead ECG available for rhythm assessment — sufficient information is evident on these 2 single lead rhythm strips to answer the above Question.


=======================================

NOTE #2: Some readers may prefer at this point to listen to the 8:00 minute ECG Audio PEARL before reading My Thoughts regarding the ECG in Figure-1. Feel free at any time to review to My Thoughts on this tracing (that appear below ECG MP-29).

=======================================


Today’s ECG Media PEARL #29 (8:00 minutes Audio) — Reviews WHAT the Ashman Phenomenon is — HOW to use it clinically? — and — whether the Ashman phenomenon is accurate when the underlying rhythm is AFib?

  • NOTE #3: For detailed review of the Ashman Phenomenon — with illustration of its clinical application — Please See ECG Blog #70. Use of the Ashman phenomenon with AFib is reviewed in ECG Blog #71.


MY THOUGHTS:

The 2 rhythm strips in Figure-1 are extremely challenging — but they provide an excellent example of deductive reasoning, in that it is only after interpreting Tracing A — that I was able to able with confidence to interpret Tracing B. Along the way — there are numerous PEARLS to discuss that are useful for optimal arrhythmia interpretation.

  • I’ll begin by giving My Answers to the above QUESTION — Choices a, b, c, d, and f are correct.
  • The only incorrect choice is e.
  • IF you disagree with any of my answers — Please READ what follows below!


Beginning with Tracing A:

In both of the tracings shown in Figure-1 — there are easier parts and more difficult parts of each tracing to interpret.

  • PEARL #1: When there are multiple components to a given rhythm strip — begin with the easier part(s) of the tracing. Most of the time — this consists of first looking for an underlying rhythm. In Tracing A — it should be clear that the initial 3 beats are sinus, because the QRS complex is narrow, and each QRS is preceded by a similar-looking P wave with a constant and normal PR interval (RED arrows in Figure-2).
  • Beat #5 clearly represents another sinus-conducted beat — because this beat manifests a similar-looking and narrow QRS complex that is preceded by a P wave with a PR interval identical to that of the PR interval preceding sinus-conducted beats #1, 2, and 3.


Figure-2: Looking first a Tracing A — I’ve added RED arrows to highlight sinus P waves that precede beats #1, 2, 3 and 5, each with an identical PR interval (See text).


PEARL #2: The most convincing evidence that an early-occurring beat is a PAC (Premature Atrial Contraction) — is being able to demonstrate that this beat is preceded by a premature P wave. Since the timing of premature P waves often coincides with the preceding ST-T wave — identifying premature P waves that are partially hidden within the ST segment can be difficult, especially if some baseline artifact over the ST segment is present. 

  • The challenge to the interpreter — is to distinguish between what is a “real” notch (ie, a notch produced by a partially hidden premature P wave) — vs what is more likely to represent either artifact or the slight “normal variation” of ECG waveforms that can often be seen with normal tracings.
  • In Figure-2 — although there is slight variation in the shape of the ST-T waves of beats #1, 2 and 4 — the shape of these ST-T waves is smooth! 
  • Although subtle — there clearly is a small notch in the T wave preceding early-occurring beat #4 (BLUE arrow in Figure-3). This small notch is a premature P wave — and its presence confirms that beat #4 is a PAC.
  • Additional support that beat #4 is a PAC is forthcoming from a similar subtle notch that precedes beat #6 (YELLOW arrow in Figure-3). Given that the ST-T waves of beats #1, 2 and 4 are smooth — and that it is only the ST-T waves of early-occurring beats #4 and 6 that manifest subtle notching — we have to presume that this notching is real, and the result of partially hidden premature P waves. This proves that beats #4 and #6 are PACs.


Figure-3: I’ve added BLUE and YELLOW arrows to Figure-2 that highlight subtle notching in the preceding T waves, which confirms that beats #4 and 6 are PACs (See text).


PEARL #3: The reason the QRS complex of beat #6 in Figure-3 looks different than the QRS complex of the first 5 beats in this tracing — is that beat #6 is conducted with RBBB (Right Bundle Branch Block) Aberration.

  • As discussed in detail in ECG Blog #211 — the most common form of aberrant conduction is with RBBB morphology. This is because in most patients, the right bundle branch generally has a longer refractory period than the refractory period of other conduction fascicles.
  • QRS morphology of beat #6 in Figure-3 is absolutely typical for RBBB because: i) The QRS complex of beat #6 is slightly, but not excessively widened — compared to sinus-conducted beats #1, 2, 3 and 5; ii) There is a triphasic rSR’ morphology to beat #6 in this right-sided lead MCL-1, with a similar, slender initial positive r wave deflection — followed by an S wave that descends below the baseline — and finishing with a “taller-right-rabbit-ear” R' deflection; and, iii) The Ashman Phenomenon is present!


PEARL #4: As reviewed above in today’s Audio PEARL (MP-29) — as well as in our ECG Blog #70 — the Ashman Phenomenon is most easily summarized by saying, “The funniest-looking (most different) beat tends to follow the longest pause.”

  • The longest “pause” in Figure-3 is the R-R interval between beats #4-5. This longer preceding R-R interval “sets up” conditions that predispose to aberrant conduction — because this longer R-R interval serves to prolong the subsequent absolute and relative refractory periods.
  • NOTE: The coupling intervals for the P waves represented by the BLUE and YELLOW arrows in Figure-3 are virtually equal. The reason beat #6 conducts with RBBB aberration (whereas premature beat #4 with an identical PAC-coupling interval, conducts normally) — is that the longer pause before beat #5 lengthens the subsequent refractory period. This is the Ashman phenomenon!
  • Recognition of the Ashman phenomenon in Figure-3 is essential for “solving” this rhythm — because thisremoves all doubt about the reason why beat #6 is wider and looks different than the 5 normal-looking beats that come before it. We now have a reason for aberrant conduction — and, we have a reason why beat #6 shows RBBB aberration but beat #4 does not.
  • PEARL #5: Since we now know that beat #6 is aberrantly conducted — it is highly likely that all other beats in Tracing A and in Tracing B that look similar to beat #6 are also conducted with RBBB aberration. Therefore — beats #7, 13 and 14 in Figure-3 are also almost certain to be aberrantly conducted. NOTE: It is common for there to be slight variation in QRS morphology with aberration — so the fact that the S wave of beat #7 does not descend below the baseline does not at all dissuade me from strong belief that beats #6, 7; 13 and 14 in Figure-3 are all aberrantly conducted!


Continuing with my assessment of Tracing A:

  • P waves are “lost” after beat #6 in Figure-3. Undulations in the baseline persist — but clearly defined P waves are no longer seen. Caliper measurement of R-R intervals, beginning with beat #6 — until the end of the tracing — reveals subtle-but-real variation in many (most) of the R-R intervals. Taking into account development of coarse baseline undulations that begin after beat #6 — it appears that this patient has developed AFib (Atrial Fibrillation), here with a rapid ventricular response and coarse “fib waves”.
  • PEARL #6: When the ventricular response of AFib is rapid (as it is in Figure-3) — the R-R interval may lookregular, when in fact — subtle-but-real variation in the R-R interval persists.


NOTE: Obviously in practice, there will not always be time to pull out calipers when you are at the bedside with an acutely ill patient. I will emphasize that I did not need calipers to know that the R-R interval for beats #6-thru-16 in Figure-3 is not completely regular. With practice — it becomes easier to recognize this slight-but-real irregularity, even without calipers. That said, when I do have the time — I use calipers for confirmation.

  • PEARL #7: As reviewed above in today’s Audio PEARL (MP-29) — and in our ECG Blog #71 — the Ashman phenomenon may be somewhat less reliable in the setting of AFib. Because the rate of atrial fibrillatory waves is so fast (often between 400-to-600 fib wave impulses per minute) — the potential for “concealed” conduction (that is, partial conduction through the atria into the AV node) is great — and this can alter conduction properties enough to alter refractory period duration in an unpredictable manner. That said — I still use the Ashman Phenomenon in AFib, and much of the time it works. But because of this potential for concealed conduction — realize that the Ashman Phenomenon is not as reliable with AFib as it tends to be during sinus rhythm.
  • I suspect the reason beats #13 and 14 in Figure-3 are aberrantly conducted despite no lengthening of the preceding R-R interval — may be the result of “concealed” conduction that occurs here in association with AFib.


Moving on to Tracing B:

For clarity — I’ve combined Tracing A and Tracing B in Figure-4.

  • PEARL #8: I am a firm believer in what I call the “Birds-of-a-Feather” Concept. This concept states that IF a certain rhythm phenomenon occurs in one part of a tracing – that it is likely to occur again in other parts of the tracing (or in subsequent tracings obtained from this same patient). We’ll see in a moment how this concept proves invaluable, as we begin to assess Tracing B.


Figure-4: For clarity — I’ve again put Tracings A and B together (See text).


Tracing B is remarkable for the introduction of a new QRS morphology — namely the 4 successive widened beats in the middle of this rhythm strip ( = beats #13, 14, 15, 16).

  • Once again — I favor applying the concept I presented earlier in PEARL #1 — namely to start with those parts of a complex tracing that we have already figured out. Beats #1-thru-9; beat #12 — and beats #17-thru-22 in Figure-4 are clearly all supraventricular, and similar in morphology to sinus-conducted beats #1, 2, 3 and 5 in Tracing A.
  • Beats #10 and 11 in Figure-4 are virtually certain to be supraventricular with RBBB aberration — because their morphology is identical to the 4 beats in Tracing A that we identified as aberrantly conducted.
  • P waves are absent in Tracing B. Undulations in the baseline are seen that look very much like the “fib waves” we identified in Tracing A. And even without calipers — it should be apparent that all of these beats are irregularly irregular. Therefore, the underlying rhythm in Figure-4 continues to be AFib with a rapidventricular response.


All that remains — is to determine the etiology of beats #13, 14, 15 and 16 in Figure-4, which manifest a new QRS morphology (ie, predominantly negative wide beats). I’ll do this by making several observations.

  • The underlying rhythm for the latter half of Tracing A, and for the beats we have thus far commented on in Tracing B is rapid AFib. By the “Birds-of-a-Feather” Concept ( = PEARL #8) — perhaps AFib might be present for the entire duration of Tracing B?
  • Note that there is no “post-ectopic pause” after the 4-beat run of predominantly negative wide beats (beats #13-thru-16). Instead, the underlying pattern of ever-so-slight-but-real irregular irregularity is maintained throughout the entire rhythm strip in Tracing B.
  • Although LBBB aberration is decidedly less common than RBBB or LAHB aberration — it does occur. The predominantly negative QRS complex in this right-sided lead MCL-1, with no more than thin, tiny initial r wave and very steep descent of the S wave is consistent with typical LBBB morphology.
  • PEARL #9: This case reminds me of an uncommon but highly specific ECG finding cited by Dr. Barney Marriott — namely, that in the setting of rapid AFib — if ever you see one or more beats of RBBB aberration separated by a single normal-appearing beat — before onset of a 2nd QRS morphology that is potentially consistent with LBBB aberration — that this pattern is virtually diagnostic of shifting LBBB and RBBB aberration. Isn’t this precisely what we see in Tracing B? — namely, beats #10 and 11 conduct with RBBB aberration — beat #12 manifests normal QRS morphology — and then, beats #13-thru-16 are perfectly consistent with LBBB aberration.


Clinical Implications:

The importance of recognizing that all beats in Figure-4 are supraventricular, is that there is no need to worry about having to contemplate antiarrhythmic treatment for runs of VT — even if longer runs of the predominantly negative wide beats were to be seen.

  • Treat the Primary! After the first 5 beats in Tracing A — the underlying rhythm became rapid AFib. Finding and correcting any potentially precipitating causes of new AFib — and, if needed in the process, use of AV nodal rate-slowing medications is likely to control the ventricular response (if not result in conversion to sinus rhythm) — and chances are that most (if not all) wide beats will resolve once this is done.


==============================

Relevant ECG Blog Posts to Today’s Case:

  • ECG Blog #70 — Reviews the basics of the Ashman Phenomenon. 
  • ECG Blog #71 — Is the Ashman Phenomenon accurate in AFib? 
  • ECG Blog #211 — Reviews in detail WHY aberrant conduction occurs (and why RBBB aberration is the most common form).


Monday, April 5, 2021

ECG Blog #211 — Why Aberrant Conduction?


Interpret the 2 rhythm strips shown below in Figure-1, using the Ps, Qs & 3R Approach. Both patients are hemodynamically stable.

  • NOTE #1: Lead MCL-1 is a right-sided monitoring lead that provides a similar perspective as is seen in lead V1 on a 12-lead tracing. And, although ideally, we would have a complete 12-lead ECG available for rhythm assessment — sufficient information is evident in the single lead given to answer the Question below.


QUESTION: The different-looking beats in both Tracing A and Tracing B show "rabbit ears". WHICH of the following statements is true?

  • a) Aberrant conduction is present in both tracings.
  • b) Aberrant conduction accounts for the different-looking beats in A — but not in B.
  • c) Aberrant conduction accounts for the different-looking beat in B — but not for the different-looking beats in A.
  • d) Neither tracing shows aberrant conduction. The different-looking beats in both A and B are all PVCs.


Figure-1: Interpret Rhythm A and Rhythm B. Are the different-looking beat PVCs or PACs that conduct with aberration?


=======================================

NOTE #2: Some readers may prefer at this point to watch to the 4:45 minute ECG Video PEARL before reading My Thoughts regarding the 2 rhythms shown in Figure-1. Feel free at any time to review to My Thoughts on these rhythms.

=======================================


Today’s ECG Media PEARL #28 (4:45 minutes Video) — Reviews WHY some early beats and some SVT rhythms are conducted with Aberration (and why the most common form of aberrant conduction manifests RBBB morphology).

  • NOTE #3: I have excerpted a 6-page written summary regarding Aberrant Conduction from my ACLS-2013-ePub. This appears below in the Addendum (in Figures-4, -5, and -6).
  • CLICK HERE — to download a PDF of this 6-page file on Aberrant Conduction.

=======================================


MY THOUGHTS on Rhythm A in Figure-1:

There are several things going on in Rhythm A. In such cases — I find it easiest to first look for an underlying rhythm:

  • The underlying rhythm in A is sinus — as determined by beats #1, 2 — 4, 5, 6 — 8, 9, 10 and 13. Although there is slight variation in QRS morphology (due to baseline artifact) — it should be apparent that for each of the above 9 beats, the QRS complex is narrow — the R-R interval that separates these beats is constant (and measures just over 3 large boxes in duration) — and a similar-morphology P wave with a constant and normal PR interval is seen (RED arrows in Figure-2). Therefore — there is an underlying sinus rhythm at ~90-95/minute.


Figure-2: I’ve added colored arrows to Rhythm A to highlight atrial activity (See text).


The QRS complex for 4 of the 13 beats shown in rhythm A looks different than the 9 sinus-conducted beats. There are a number of reasons why we can say with 100% certainty that beats #3, 7, 11 and 12 are all PACs that conduct with aberration.

  • Beats #3, 7 and 11 are all preceded by early-occurring P waves (light BLUE arrows). The most obvious of these premature P waves is the 1st BLUE arrow (that appears before beat #3) — which highlights an extremely tall and pointed P wave. The next 2 BLUE arrows (before beats #7 and 11) are more subtle — but the notching within the T waves is early and unmistakably different in morphology from the biphasic P waves of sinus beats.
  • QRS morphology for each of the different-looking QRS complexes in A is highly typical for RBBB conduction because: i) The initial QRS deflection for beats #3, 7, 11 and 12 is a small and thin r wave — that is similar to the small initial r wave in the sinus-conducted beats; and, ii) Each of these different-looking beats manifests an S wave that descends below the baseline — and finishes with a tall and slender R’ complex (ie, a taller right “rabbit ear”).
  • The reason beat #7 is a little bit narrower and lacks a tall R’ wave — is that this PAC conducts with a pattern of incomplete (rather than complete) RBBB aberration.
  • For MORE regarding the expected typical QRS morphology for RBBB aberration — See Sections 19.4, 19.5 and 19.6 in Figure-5 and Figure-6 in the Addendum below.
  • BOTTOM LINE: The rhythm in A (as shown in Figure-2) — is sinus with PACs that conduct with RBBB aberration.


MY THOUGHTS on Rhythm B in Figure-1:

There is only 1 different-looking beat in Rhythm B ( = beat #4).

  • Once again — I find the easiest way to assess this tracing is to look for an underlying rhythm (Figure-3):


Figure-3: I’ve added RED arrows to Rhythm B to highlight persistence of regular sinus P waves (See text).


There are a number of reasons why despite the presence of a taller right “rabbit ear” for beat #4 — this beat is not aberrantly conducted. Instead — we can say with virtual certainty that beat #4 in B is a PVC.

  • FIRST — The presence of “rabbit ears” is only helpful when seen in a right-sided lead (such as lead V1 on a standard 12-lead tracing — or lead MCL-1 of a monitoring lead). There is no diagnostic benefit from the rR’ complex we see for beat #4 in B.
  • The underlying rhythm in B is sinus with a long PR interval (RED arrows in Figure-3). The QRS complex is wide (about 0.12 second) — so some type of underlying bundle branch block is present. Nevertheless — the presence of regularly-occurring upright P waves in lead II with a constant (albeit prolonged) PR interval confirms that the underlying rhythm is sinus.
  • KEY POINT: Instead of the P wave preceding beat #4 being early — this P wave ( = the 4th RED arrow in Figure-3) occurs precisely on time! Note that the PR interval preceding beat #4 is unmistakably shorter than the PR interval preceding each of the sinus-conducted beats in this tracing. This means that “something else” (ie, something arising from below the AV node) must have occurred before the P wave preceding beat #4 had a chance to conduct to the ventricles, which by itself proves that beat #4 must be a PVC.
  • Unlike the situation in rhythm A — the pause that contains the different-looking beat (ie, the R-R interval between beats #3-to-5) is “compensatory” (ie, equal to exactly twice the R-R interval of normal sinus beats). The R-R interval that contains isolated PVCs often (albeit not always) is perfectly “compensatory” — reflecting the fact that many PVCs do not conduct back to the atria to reset the SA node. This is different than what occurs with PACs — that routinely reset the SA node because of their occurrence in the atria.
  • There is no reason for beat #4 in B to conduct with aberration. This is because this premature beat occurs late in the cycle (ie, well after the end of the T wave of the preceding beat). Aberrantly-conducted beats generally occur much earlier in the R-R interval, during which time a portion of the conduction system is far more likely to still be refractory (as was the case for the aberrantly conducted PACs seen in rhythm A).
  • Finally — QRS morphology of beat #4 in rhythm B is completely different than the QRS morphology of normal sinus beats. Note in particular, how the initial deflection of beat #4 (which is a small-but-wide and rounded initial positive deflection) is nothing like the thinner, more-rapidly-rising and taller initial R wave seen in each of the sinus-conducted beats.
  • BOTTOM LINE: Taken together, the above-noted findings overwhelmingly suggest that the rhythm in B (as shown in Figure-3) — is sinus with 1st-degree AV block and a PVC ( = beat #4).


============================

ADDENDUM (4/5/2021) In the following 3 Figures — I post written summary from my ACLS-2013-ePub regarding the basics of Aberrant Conduction.

  • CLICK HERE — for a PDF of this 6-page file on the basics of Aberrant Conduction that appears in Figures-4, -5, -6.


Figure-4: Aberrant Conduction — Refractory periods/Coupling intervals (from my ACLS-2013-ePub).


Figure-5: Aberrant Conduction (Continued) — QRS morphology/Rabbit Ears.


Figure-6: Aberrant Conduction (Continued) — Example/Summary.


==============================

Relevant ECG Blog Posts to Today’s Case:

  • ECG Blog #140 — Example of alternating Bifascicular Block Aberration.
  • ECG Blog #14 — Example of Blocked PACs.
  • ECG Blog #15 — Example of a WCT due to Aberrant Conduction.
  • ECG Blog #33 — Example of PACs with varying degrees of Aberrant Conduction.


Friday, April 2, 2021

ECG Blog #210 — A WCT: How Fast the Rate?


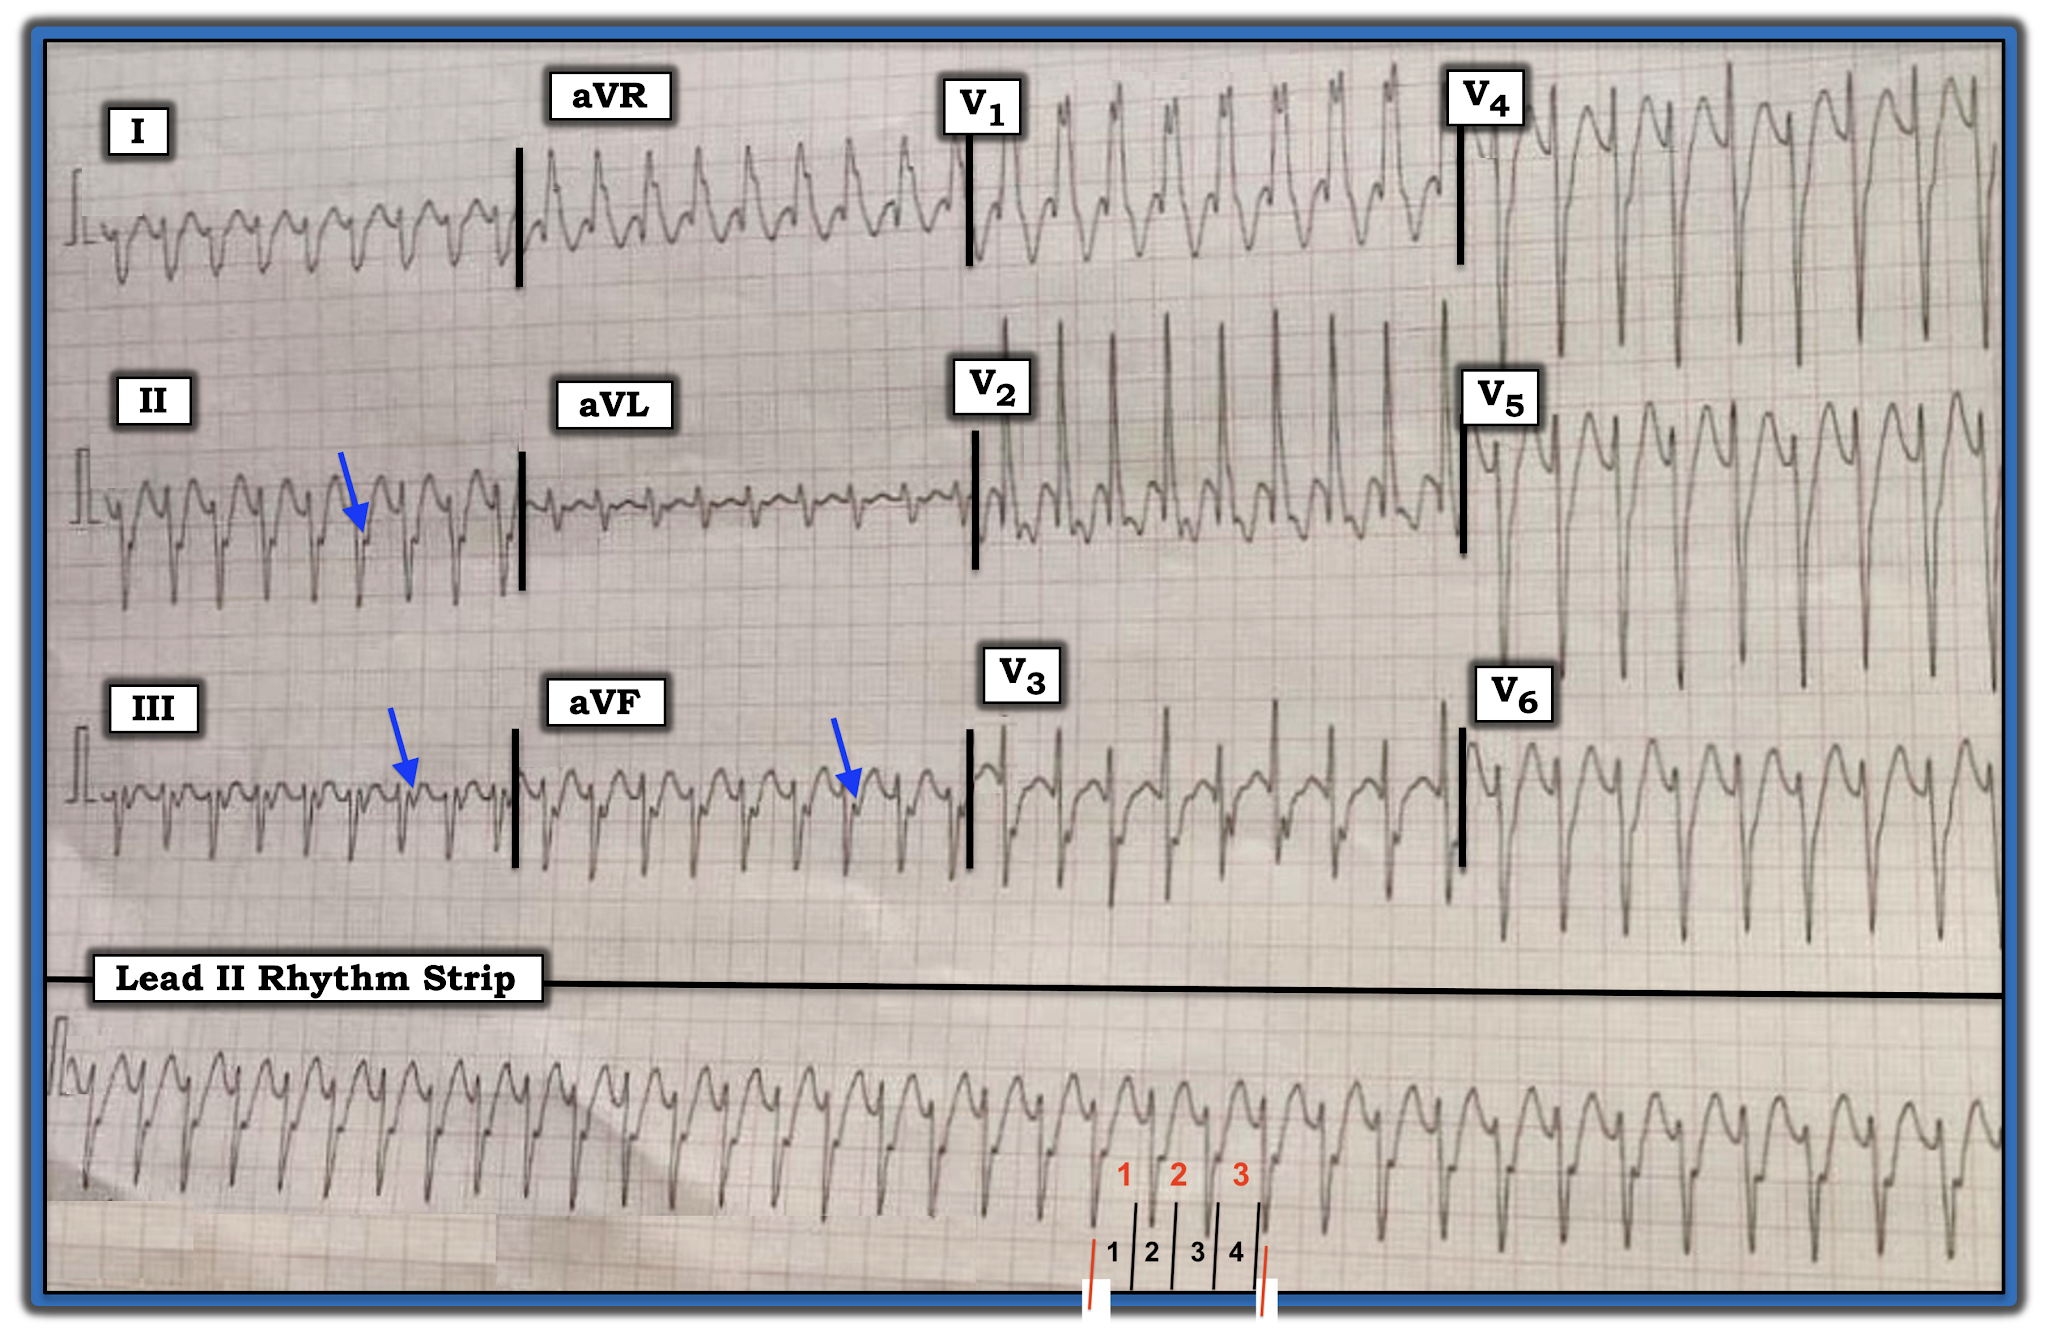
The ECG in Figure-1 was obtained from a 30-year-old man with palpitations. He was hemodynamically stable at the time this tracing was done. 

  • WHAT is the rhythm? — Is this VT or SVT?


Figure-1: ECG obtained from a 30-year-old man with palpitations (See text).


=======================================

NOTE #1: Before working through this case — I wanted to review a fast and accurate method for estimating heart rate when the rhythm is rapid.

=======================================


Today’s ECG Media PEARL #27 (3:00 minutes Video) — Reviews the Rule of 300 for estimating heart rate — and — @ 1:25 minutes in the video, the Every-Other-Beat Method for Estimating Rate with fast rhythms.

  • NOTE #2: Sometimes it is easier instead of assessing the R-R interval for every-other-beat — to assess the R-R interval for every-third- or every-fourth- beat. We illustrate this in Figure-2. 


Figure-2: A short look in 2 leads at another WCT rhythm. How fast is the heart rate?


HOW Fast is the Rate in Figure-2?

Looking every-third-beat is easiest in this example — because I found a 3-beat period in the rhythm in which a part of the QRS at the beginning and at the end falls either on (or almost on) a heavy grid line (as per the 2 vertical RED lines in Figure-2).

  • I first selected a readily identifiable part of the QRS complex that begins on a heavy line. In Figure-2 — I chose the 2nd beat in lead II (See the 1st vertical RED line under this beat). Using the Every-Third-Beat Method — the amount of time that it takes to record 3 beats (RED numbers in lead II) is just under 5 large boxes (BLUE numbers in this Figure). Therefore — ONE THIRD the rate is a little faster than 300/5 ~60-65/minute.
  • Therefore — the actual rate for the rhythm in Figure-2 is ~60-65 X 3 ~185-190/minute. 


PEARL #1: Knowing the actual rate of a tachycardia can be extremely helpful in working through the differential diagnosis of the rhythm. This is especially true with SVT (SupraVentricular Tachycardia) rhythms because:

  • While not impossible — Sinus Tachycardia becomes much less likely in a non-exercising adult IF the rate of the unknown tachycardia exceeds ~170/minute.
  • Untreated AFlutter most commonly presents with a ventricular rate that is close to 150/minute (~135-165/minute range). This is because the untreated rate of flutter in the atria of adults is most commonly close to 300/minute — which with 2:1 AV conduction, results in a ventricular rate close to ~150/minute. Therefore — AFlutter also becomes unlikely when the rate of an unknown SVT rhythm exceeds ~170/minute (as this would require a ventricular rate of over 340/minute if 2:1 AV conduction was maintained).
  • In contrast, an SVT rhythm for which the ventricular rate is in the range of ~140-150/minute, provides NO Clue to etiology — because each of the most common diagnostic possibilities (ie, Sinus Tach — ATach — AFlutter — AVNRT/AVRT) may all present with a ventricular rate in the range of ~140-150/minute.


=======================================

— Returning to Today’s Case —

=======================================


MY Approach to the Rhythm in Figure-1:

Unfortunately, the 12-lead ECG with long lead II rhythm strip shown in Figure-1 is “technically challenged” (ie, slanted). That said — I believe the quality of this tracing is still adequate for accurate rhythm assessment. By the “Ps, Qs & 3R Approach” that I favor (Reviewed in ECG Blog #185):

  • The QRS complex is wide (clearly more than 3 little boxes = >0.12 second in duration).
  • Normal sinus P waves are absent (ie, there is NO clear sign of upright P waves in lead II — See Pearl #2 below).
  • There are therefore no sinus P waves that might be Related to neighboring QRS complexes.
  • The rhythm is Regular (ie, despite the slant of the tracing — the QRS complex remains regular throughout the long lead II rhythm strip).


Finally, regarding the 5th Parameter in the Ps, Qs & 3R Approach — I estimate the Rate of the rhythm in Figure-1 to be ~210/minute. 

  • To estimate this — I used the Every-Third-Beat Method (Figure-3). I began by selecting a QRS complex for which the deep negative point of the QRS fell precisely on a heavy grid line (See the 1st vertical RED line in the long lead II under this beat).
  • The amount of time that it takes to record 3 beats (RED numbers in the long lead II) is just over 4 large boxes (BLACK numbers in Figure-3). Therefore — ONE THIRD the rate is a little slower than 300/4 ~70/minute.
  • Therefore — the actual rate for the rhythm in Figure-3 is ~70 X 3 ~210/minute. 


PEARL #2: I can not rule out the possibility that the negative deflection seen in each of the 3 inferior leads at the end of the QRS complex in Figure-3 (BLUE arrows) might represent retrograde atrial activity. That said, even IF this was retrograde 1:1 VA conduction — this would not help diagnostically, because both VT and reentry SVT rhythms may manifest 1:1 VA conduction.

  • After conversion to sinus rhythm — we’ll be able to tell IF this negative deflection did indeed represent retrograde atrial activity (IF it did — then this negative deflection highlighted by the BLUE arrows in Figure-3 should no longer be present once sinus P waves return). 


Figure-3: I’ve labeled Figure-1 with BLUE arrows (that highlight possible retrograde atrial activity) — and, with RED and BLACK numbers in the long lead II rhythm strip to illustrate how I estimated heart rate (See text).


Putting It All Together:

By the Ps, Qs & 3R Approach — we have defined a regular WCT (Wide-Complex Tachycardia) Rhythm at ~210/minute, without clear sign of sinus P waves.

  • The fact that the patient is a young adult (ie, a 30-year-old man) — does not rule out the possibility of VT. As discussed in detail in ECG Blog #197 — some form of idiopathic VT (ie, VT in a patient without underlying heart disease) is more common among young adults than is often appreciated — especially when onset of the regular WCT rhythm occurs during activity.
  • The “good news” — is that: i) The overall course and prognosis (both short-term and long-term) of idiopathic VT tends to be much better than for ischemic VT; and, ii) Initial treatment (with either Adenosine or Verapamil/Diltiazem — depending on the type of idiopathic VT, as discussed in Blog #197) is often successful in converting the WCT rhythm, regardless of whether the etiology is idiopathic VT or some form of SVT with aberrant conduction.
  • Aberrant conduction generally manifests a QRS morphology typical for some form of known conduction block — either RBBB, LABB; one of the hemiblocks (ie, LAHB, LPHB) — or bifascicular block (ie, RBBB/LAHB or RBBB/LPHB).


PEARL #3: IF QRS morphology during the WCT rhythm is completely typical for some form of known conduction block — this strongly favors a supraventricular etiology. IF on the other hand, QRS morphology during the WCT rhythm is clearly atypical for any known form of conduction block — this favors VT.

  • That said — Exceptions always exist. Nothing is 100%. For example — SVT rhythms may manifest extremely atypical QRS morphology during a WCT if the patient’s baseline ECG shows the same very atypical QRS morphology (as might occur if the patient had severe underlying ischemic heart disease, congenital heart disease, cardiomyopathy, etc). In addition, some forms of VT may simulate known conduction defects IF origin of the ventricular rhythm is near (or passes through) one or more of the conduction fascicles. KEY Point: Despite possible exceptions — I have found assessment of QRS morphology during the WCT rhythm to be extremely helpful in predicting the likely etiology of the rhythm.
  • NOTE: For review of the expected QRS morphology for the bundle branch blocks, the hemiblocks, and bifascicular blocks — Please SEE ECG Blog #203 and Blog #204.


Regarding QRS Morphology in Figure-3:

QRS morphology for the regular WCT rhythm in Figure-3 resembles RBBB — because there is a wide, predominant positive QRS complex in lead V1 — with wide terminal S waves in lateral leads I and V6. That said — there are several atypical features that to me strongly suggests that this rhythm is likely to represent a form of Fascicular VT. The atypical features in QRS morphology include:

  • Although QRS morphology in lead V1 of Figure-3 is wide and predominantly positive — there is no initial r wave and, the R’ deflection is both very wide and notched (whereas with typical RBBB morphology — the R’ deflection is usually thinner and not notched).
  • There are anterior Q waves (seen here in leads V1 and V2) — whereas this is usually not seen with typical RBBB morphology unless there has been prior anterior infarction (which is clearly less likely to have occurred in a previously healthy 30-year-old).
  • The frontal plane axis is indeterminate (ie, there is predominant negativity in leads I, II and III). Neither of the hemiblocks normally manifest predominant negativity in all 3 of the standard limb leads (whereas this pattern is not uncommon with fascicular VT).
  • BOTTOM LINE: At the time that I wrote this post, I did not yet have follow-up in this case — so I do not yet have a definitive answer. That said — given that the patient is a presumably previously healthy 30-year-old man (therefore, unlikely to have a baseline ECG showing preexisting RBBB with an atypical QRS morphology) — I thought the rhythm for the ECG shown in Figure-3 was most likely Fascicular VT. I would treat the patient accordingly (ie, with initial trial of IV Verapamil, given that the patient is hemodynamically stable).


Figure-4: Use of lead V1 for assessing QRS morphology during a regular WCT rhythm (Further discussion regarding this Figure can be found on ECG Blog #196).


-------------------------------------------------------------------------

Acknowledgment: My appreciation to Anil Kumar Kolli and Mohan Prasad (from Pradesh, India) for the case and this tracing.

-------------------------------------------------------------------------


==============================

Relevant ECG Blog Posts to Today’s Case:

  • ECG Blog #185 — Reviews my Systematic Approach to Rhythm Interpretation using the “Ps, Qs & 3R Approach”.
  • ECG Blog #196 — Reviews my approach to the Regular WCT.
  • ECG Blog #197 — Reviews the ECG diagnosis of Idopathic VT (including RVOT VT and Fascicular VT).
  • ECG Blog #203 — Reviews the expected QRS morphology for the Hemiblocks and Bifascicular Blocks (ie, LAHB, LPHB; RBBB/LAHB; RBBB/LPHB).
  • ECG Blog #204 — Reviews the expected QRS morphology for Bundle Branch Block (ie, RBBB, LBBB, IVCD).